Scottish Household Survey 2021 - telephone survey: key findings
A summary of the key findings from the Scottish Household Survey 2021 telephone survey.
8. Volunteering
The 2021 SHS asked respondents about any formal volunteering (giving unpaid help to organisations or groups) that they had undertaken during the previous 12 months.
Volunteering rates
Levels of formal volunteering have remained stable since 2020, with 27% of respondents in 2021 having volunteered for an organisation or group in the previous 12 months (Table 8.1).
Types of volunteering
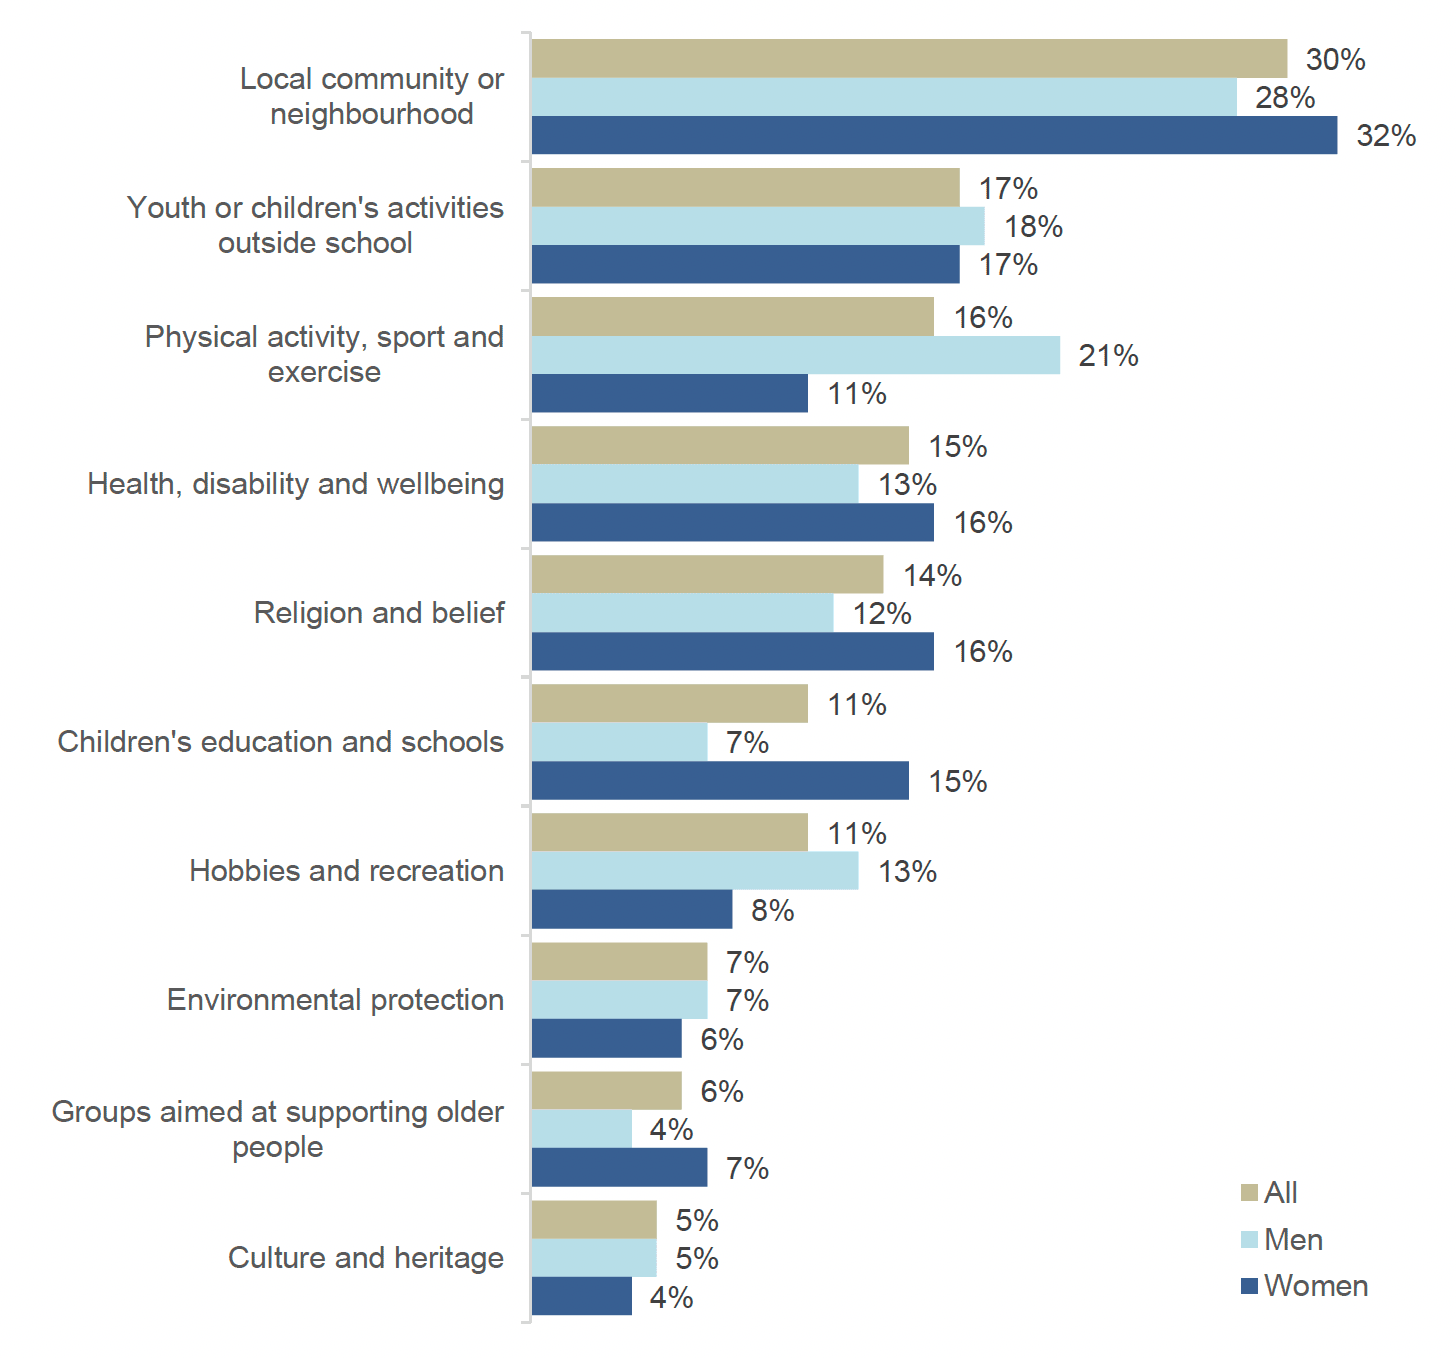
When asked which types of organisations or groups they had volunteered with, 30% of those who volunteered said they volunteered with groups and organisations working on 'local, community or neighbourhood' issues. This is a statistically significant increase compared with 25% in 2020. The high level of volunteering with this type of organisation may reflect the importance of local, community-based volunteering during the COVID-19 pandemic. 'Youth or children's activities outside school' was the second most popular type of volunteering (17%); followed by 'Physical activity, sport and exercise' (16%), an area of volunteering where participation had increased significantly since 2020 (12%) (Table 8.12)
Age, gender and volunteering
In 2021, as in 2020, men and women were equally likely to undertake formal volunteering, with 27% of men saying they had volunteered, compared with 28% of women (Table 8.3)
Women were more likely than men to volunteer with organisations supporting children's education and schools (15% of female volunteers compared with 7% of male volunteers); and organisations linked with religion and belief (16% of female volunteers compared with 12% of male volunteers) (Table 8.14)
Men were more likely than women to volunteer with organisations supporting physical activity, sport and exercise (21% of male volunteers compared with 11% of female volunteers); and with organisations focusing on hobbies and recreation (13% of male volunteers compared with 8% of female volunteers) (Table 8.14)
Participation in formal volunteering was fairly similar across different age groups in 2021, with 26% of people aged 16 to 34; 28% of people aged 35 to 59; and 28% of people aged 60 and over having volunteered in the past 12 months (Table 8.2) Younger volunteers (aged 16 to 59) were more likely than older volunteers (aged 60 or over) to be supporting organisations working with children and young people or engaging in physical activities, sport and exercise (Table 8.13).
Income, deprivation and volunteering
People living in higher-income households and less deprived areas (as defined by the Scottish Index of Multiple Deprivation – SIMD) are more likely to volunteer than those from lower-income households and more deprived areas. 30% of those living in households with a net income of over £30,000 per year had volunteered in the previous 12 months, compared with 19% of people from households earning up to £15,000 and below (Table 8.11).
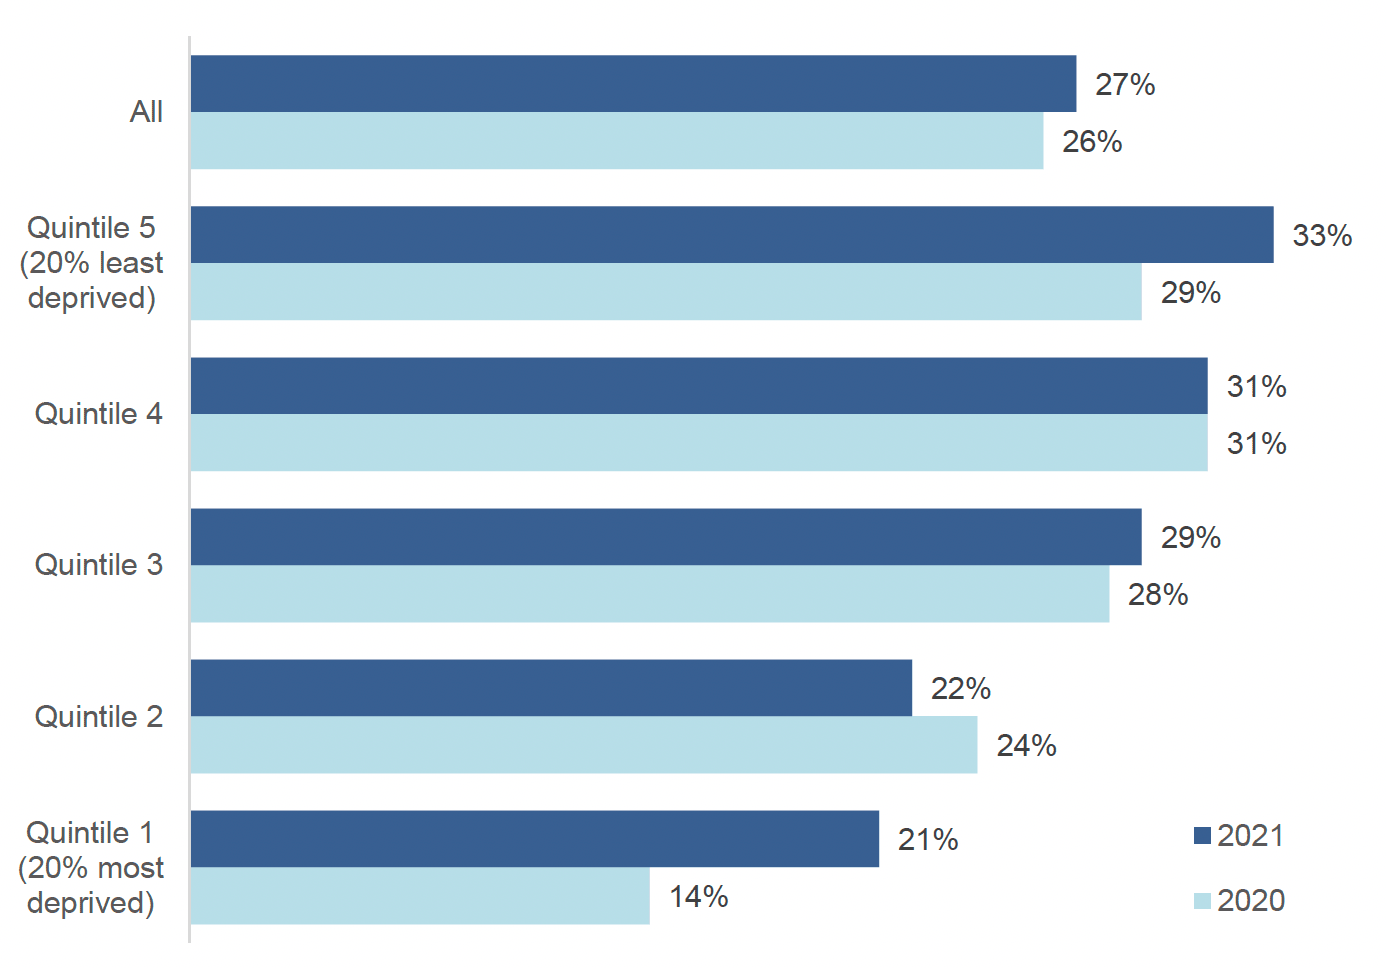
Similarly, 33% of adults living in the 20% least deprived areas (SIMD quintile 5) had volunteered, compared with 21% of those living in the 20% most deprived areas (Table 8.7). However, the percentage of people volunteering in the 20% most deprived areas (Quintile 1) had increased significantly since 2020, when just 14% of adults volunteered.
People living in the most deprived areas were more likely to volunteer for organisations working on health, disability and wellbeing than people from any other area (22% compared with 15% across all areas) (Table 8.18).
Rural/urban location and volunteering
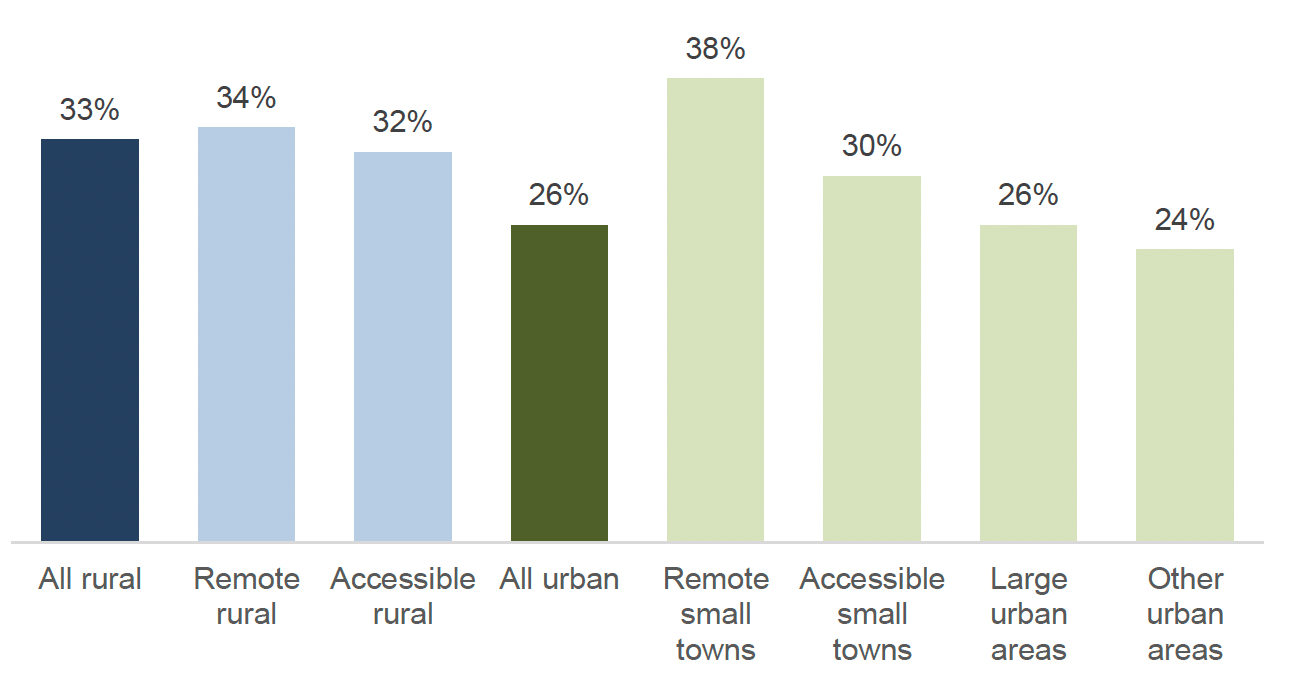
Volunteering is more common in rural areas: 33% of respondents living in rural areas had volunteered, compared with 26% of those living in urban areas (Table 8.9).
Volunteers living in remote rural and accessible rural areas were much more likely to volunteer for local community or neighbourhood organisations/groups (45% and 38% respectively) than people in large urban areas (25%) (Table 8.21).
Volunteering and disability
Disabled adults were less likely to volunteer than non-disabled adults (23% compared with 29%) (Table 8.6). Disabled people who did volunteer were much more likely to volunteer with organisations working on health, disability and wellbeing than non-disabled people (22% compared with 13%) (Table 8.17).
Volunteering and ethnicity
People who identified as 'White: Other British' were most likely to volunteer (34%) (Table 8.5). Overall, there was less variance in the rate of formal volunteering between different ethnic groups in 2021 than in 2020.
Contact
Email: shs@gov.scot