Scottish Household Survey 2021 - telephone survey: key findings
A summary of the key findings from the Scottish Household Survey 2021 telephone survey.
9. Culture and heritage
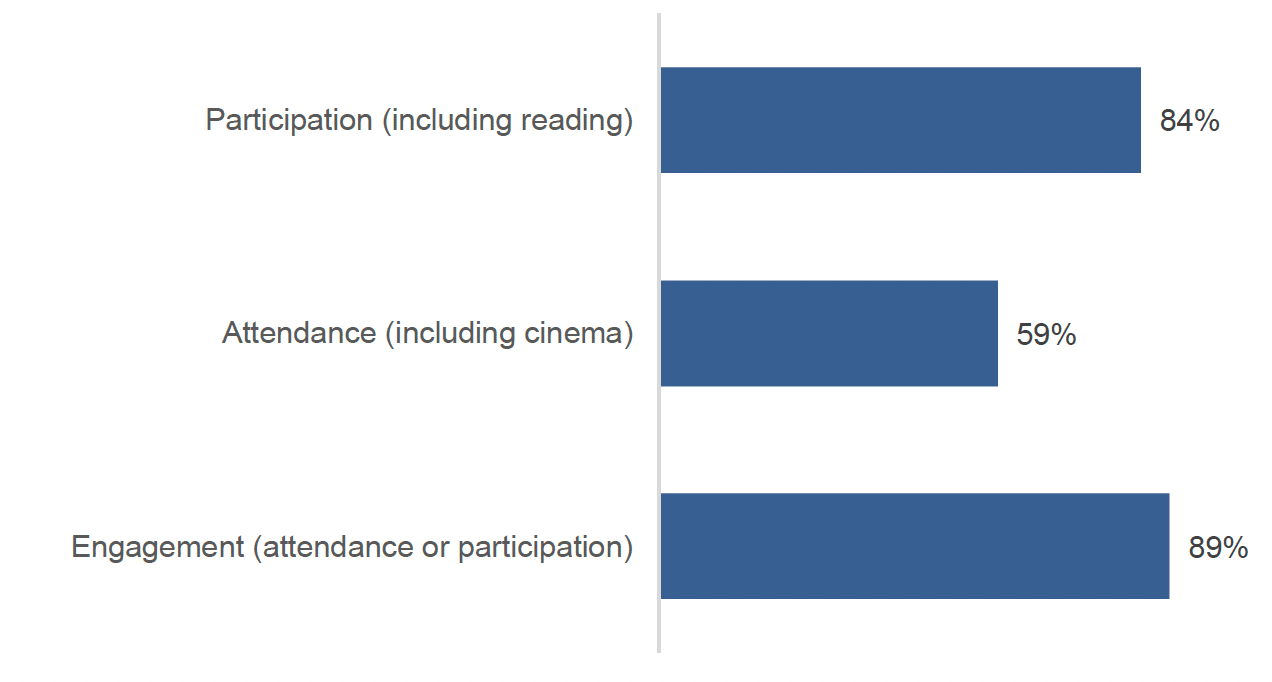
2021 data shows that 89% of adults had been culturally engaged in the last year, either by attending a cultural event or place of culture or participating in a cultural activity (Table 9.1). 59% of adults had attended a cultural event or place of culture (Table 9.2) (an increase from 44% in 2020) and 84% of adults had participated in a cultural activity (Table 9.15).
Cultural attendance
Cultural attendance is captured in the SHS by asking respondents if they have attended specific events or places, from the available list asked of respondents in the survey, at least once in the last 12 months.
When excluding cinema, the most common cultural event to attend, 51% of adults had attended a cultural event or place of culture in the last year (Table 9.2). This has increased from 39% in 2020.
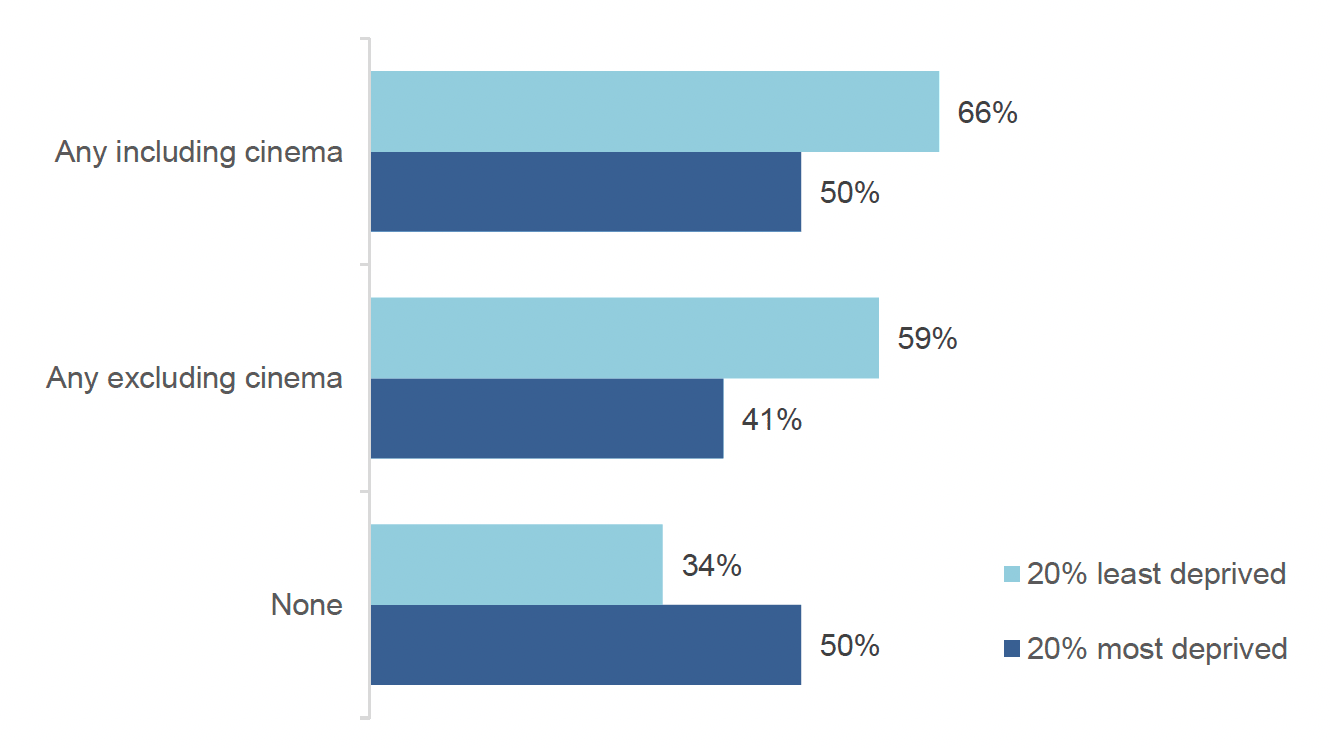
In 2021, rates of cultural attendance were highest among those living in the 'least deprived' areas as measured by the Scottish Index of Multiple Deprivation (SIMD). 50% of adults living in the 20% most deprived areas had attended a cultural event or place of culture, including the cinema, compared to 66% of adults living in the 20% least deprived areas (Table 9.5). When cinema attendance is excluded this difference was similar, with 41% of those living in the most deprived and 59% in the least deprived attending or visiting a cultural event or place.
Attendance at cultural events or places of culture also varied by age (Table 9.3). In 2021, 71% of adults aged 16 to 24 had attended a cultural event or place of culture including the cinema, compared to 34% of adults aged 75 or over (Table 9.3). While the variation in age has been maintained from 2020, for both age groups, attendance was higher.
Only 46% of disabled adults had attended a cultural event or place of culture, including the cinema, compared to 63% of non-disabled adults (Table 9.7). This has increased from 2020 (up from 32% for disabled adults and 48% for non-disabled adults).
In 2021, the cinema (30% of adults) or a historic place (28% of adults) were the most common cultural events or places of culture to attend (Table 9.2). Attendance at the following events and places was higher in 2021 than 2020: cinemas, live music events, theatres, historic places, museums, art galleries, exhibitions, street arts, culturally specific festivals, book festivals or reading groups and streaming of live performances in local venues. Attendance at libraries, classical music performances or operas, dance shows and archive or records offices remained stable between 2020 and 2021.
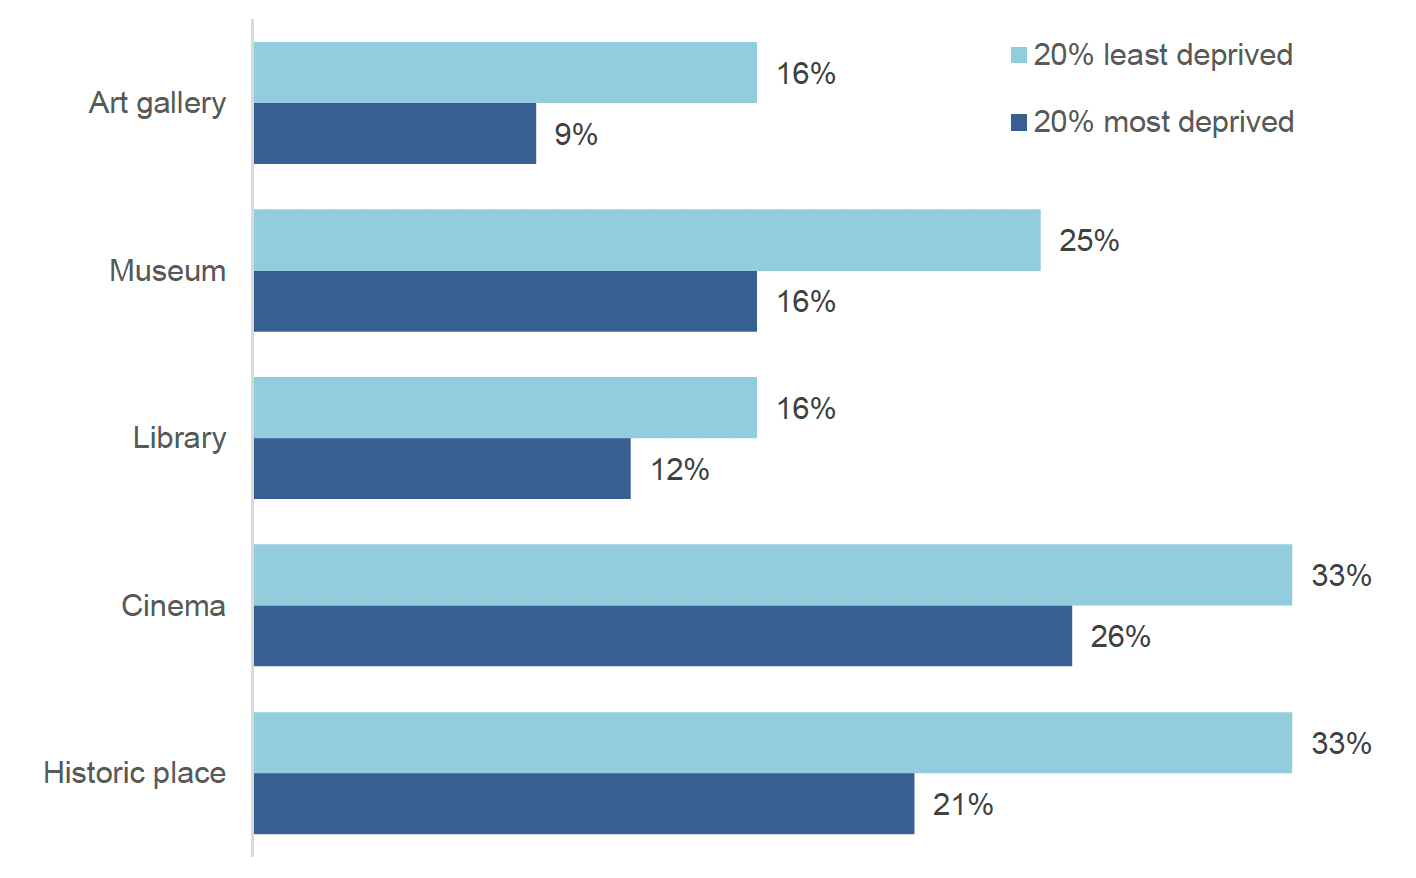
Similar to 2020, adults living in the 20% least deprived areas were more likely to have attended libraries, historic places, museums and art galleries and a live music event in the last year than those living in the 20% most deprived areas (Table 9.5).
Cultural participation
Cultural participation is captured in the SHS by asking respondents if they have done at least one activity from an available list in the last 12 months. There was a new activity added to the survey in 2020 that asked if people had participated in 'viewing performances online'.
In 2021, 84% of adults had participated in a cultural activity, including reading, in the last year. When excluding reading, 62% of adults had participated in a cultural activity (Table 9.15). These figures are similar to 2020.
When excluding reading, the most common cultural activity, adults aged 16 to 24 (71%) were more likely to have participated in a cultural activity than adults aged 75 or over (46%) (Table 9.16).
Eighty-eight percent of women had participated in a cultural activity, including reading, in the last year, compared to 79% of men. Excluding reading, 65% of women had participated in a cultural activity compared to only 58% of men (Table 9.15).
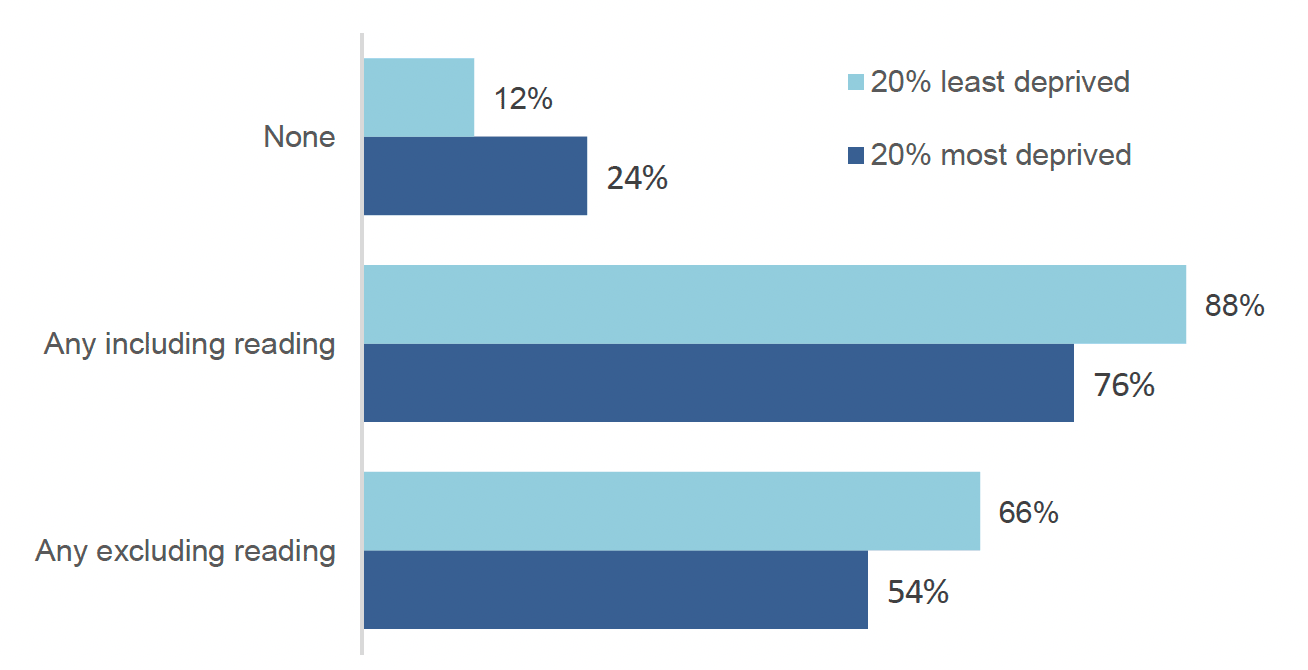
Adults living in the 20% most deprived areas were less likely to have participated in a cultural activity (54%), including or excluding reading, than those living in the 20% least deprived areas (66%) (Table 9.18).
In 2021, similar to 2020, the most common cultural activity to participate in was reading books for pleasure, with 72% of adults having read in the last year (Table 9.15). 79% of adults who read books did so at least once a week (Table 9.27) (this has decreased from 85% in 2020).
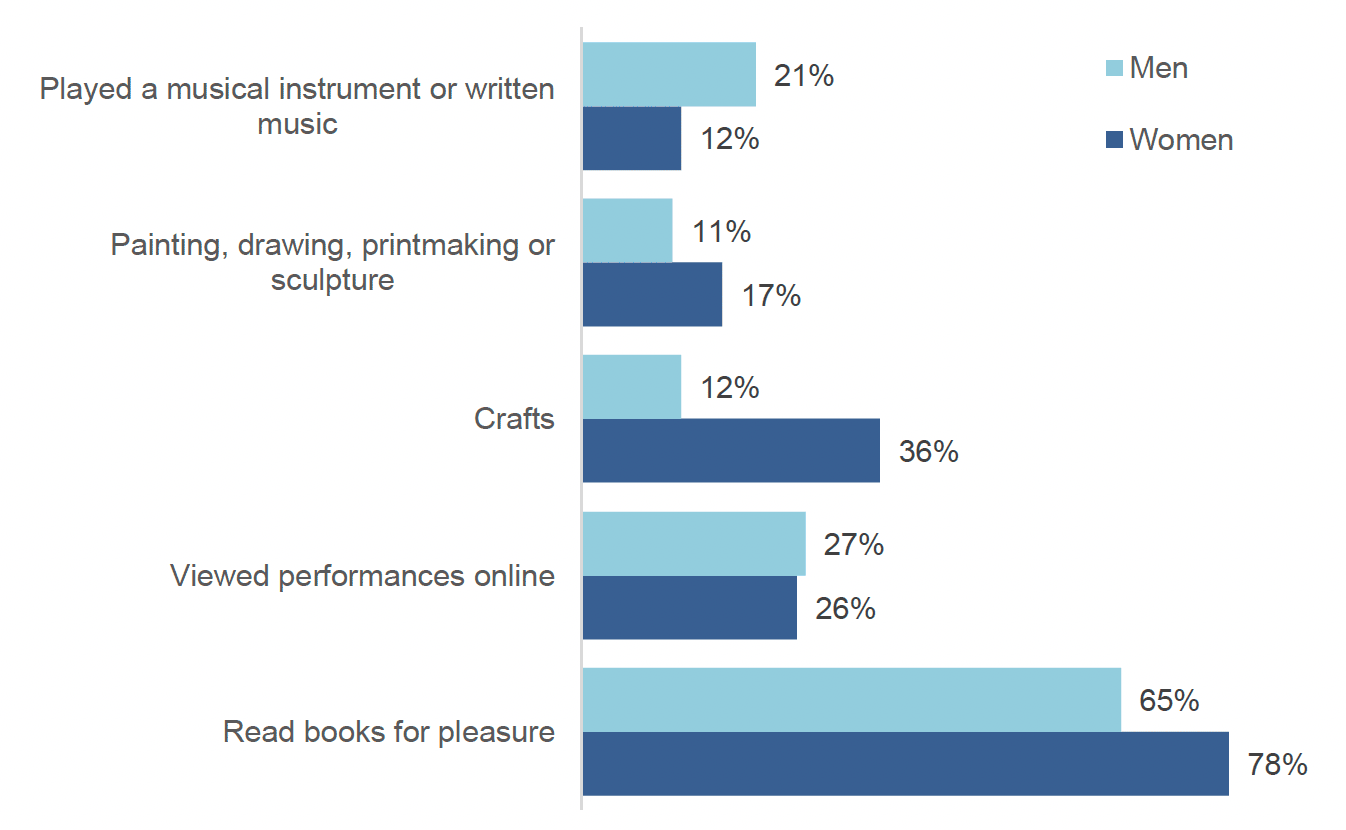
Women were more likely than men to read or participate in crafts or painting, drawing, printmaking or sculpture (Table 9.15). Men were more likely than women to have played a musical instrument or written music. A similar proportion of men and women viewed performances online (men 27%, women 26%)
In 2021, adults living in the 20% least deprived areas (79%) were more likely to read books for pleasure than adults living in the 20% most deprived areas (63%) (Table 9.18).
Adults aged 75 or over (80%) were more likely to read books for pleasure than adults aged 16 to 24 (56%) (Table 9.16). Adults aged 16 to 24 were more likely to view performances online (36%) than adults aged 75 and over (9%).
Satisfaction with services
This section presents the reported levels of satisfaction (including users and non-users of these services) for three different types of local authority cultural service (libraries, museums and galleries, theatres or concert halls).
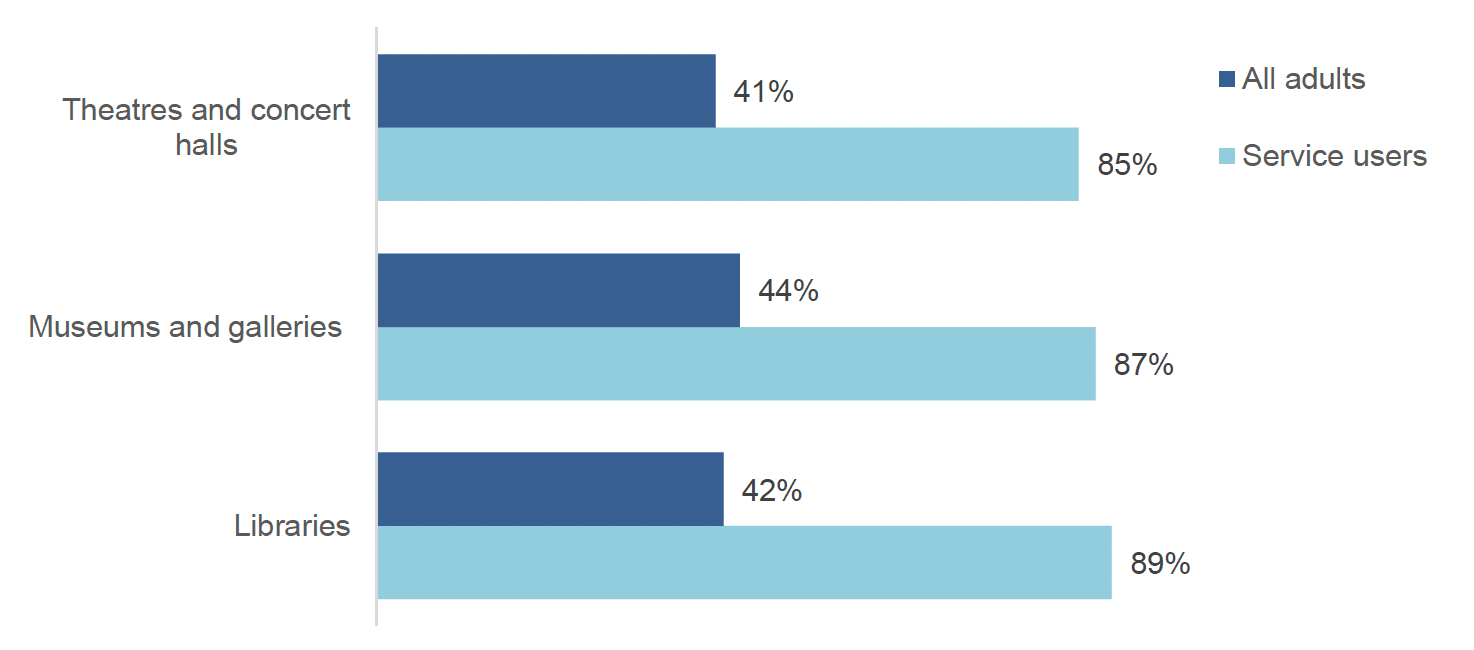
In 2021, approximately nine out of ten users were satisfied with local authority libraries, museums and galleries, and theatres and concert halls (Tables 9.64, 9.66 and 9.68). These figures have maintained since 2020.
It should be noted that satisfaction levels for 'all adults' are generally lower than among service users. This is because non service users are included, who may express no opinion about the service.
In 2021, 89% of men who had used local authority libraries were very or fairly satisfied with the service, similar to 90% of women who had used the service (Table 9.28).
Contact
Email: shs@gov.scot