The Scottish Health Survey 2008
The Scottish Health Survey 2008
8 CARDIOVASCULAR DISEASE AND DIABETES
Andy MacGregor
SUMMARY
- The prevalence of any cardiovascular disorder was similar in men and women (15.1% and 15.5%) and increased markedly with age in both sexes. The largest difference between men and women was seen in the prevalence of heart attack (reported by 4.0% of men and 2.4% of women).
- Among men and women, 18.2% reported that they had doctor-diagnosed CVD or diabetes. This increased with age for both sexes, though with women the increase with age was less pronounced.
- Overall, the prevalence of ischaemic heart disease ( IHD) or stroke was 8.7% in men and 7.5% in women and increased with age, to 35.9% in men and 26.7% in women aged 75 and over.
- The prevalence of any CVD condition, or CVD or diabetes, was not associated with the socio-economic classification of the household for either sex. In contrast, the prevalence of IHD or stroke among men and women was higher in lower supervisory and technical, and semi-routine and routine households than in managerial and professional households.
- The prevalence of any CVD disorder, CVD or diabetes, and IHD or stroke, increased as equivalised household income decreased.
- Men and women living in the most deprived areas of Scotland showed the highest rates of any CVD disorder and IHD or stroke, while those living in the least deprived areas showed the lowest rates.
- Multivariate analysis was used to explore the relationship between a range of factors and the odds of having any CVD disorder. In men the odds increased with age and were higher in those who were ex-regular smokers. For women, the odds increased with age and as household income decreased. The odds were also higher for those with lower activity levels, and those who currently smoked.
- Multivariate analysis was used to explore the factors associated with IHD or stroke for men and women aged 35 and over. Age, cigarette smoking status and diabetes were all significantly associated with IHD or stroke in both men and women. In addition, income was significant for women but not for men. The additional factors found to be significant for men were SIMD quintile and physical activity level.
- The prevalence of any CVD in men aged 16 to 64 was similar in 2008 and 2003 (9.9% and 9.7% respectively), following an increase between 1998 and 2003. For women aged 16 to 64 although there was a small increase in the prevalence of any CVD, this was not statistically significant.
8.1 INTRODUCTION
The main focus of this chapter is cardiovascular disease ( CVD). However, as outlined below, it also includes some discussion of diabetes. Future Scottish Health Survey reports will include more detailed explorations of this topic; its inclusion in this chapter is a reflection of its status as a major risk factor for CVD.
CVD is one of the leading contributors to the global disease burden. Its main components are ischaemic heart disease ( IHD) and stroke. In this report, the term IHD is used interchangeably with CHD (coronary heart disease). IHD is the second most common cause of death in Scotland after cancer; in 2008, 16% of deaths were attributed to it and a further 10% were caused by stroke. 1 Prevalence of CVD is higher in lower social classes and deprived areas. 2
Diabetes is a major risk factor for cardiovascular disease and people with a diagnosis of both conditions have significantly worse outcomes in terms of mortality and morbidity than those with a CVD diagnosis alone. 3 Diabetes is an endocrinal condition characterised by raised blood glucose levels as a result of impaired insulin function; the condition takes two forms. Type 1 diabetes is caused by an unpreventable autoimmune destruction of the pancreatic cells that produce insulin and its onset is generally, but not always, early on in life. Type 2 diabetes is the more common form of the condition and is estimated to account for around 87% of all cases in Scotland. 3 It occurs when the body becomes unable to respond to insulin, or to produce it, or both. Type 2 diabetes is commonly associated with being overweight or obese. While its prevalence is more common in older age groups its onset in childhood and early adulthood is increasing. Type 2 diabetes can be prevented, or at least delayed, in many instances.
Many of the targets and initiatives relating to smoking, alcohol consumption, diet, physical activity and obesity set out in earlier chapters have the potential to impact on CVD. In addition, a number of the Scottish Government's National Performance Framework national indicators, 4 as set out in Chapter 1, have a specific focus on CVD and inequalities. Of most direct relevance here is the aspiration to:
Reduce mortality from coronary heart disease among the under 75s in deprived areas
As the national indicator suggests, health policy in Scotland is increasingly focusing on the elimination of health inequalities and the establishment in 2007 of a Ministerial Taskforce on Health Inequalities has contributed to this approach . The Taskforce's 2008 report, Equally Well,5 has helped inform the targeting of policy initiatives on people in deprived communities who are at most risk of poor health.
In 2007 the Scottish Government published Better Health, Better Care,6 its action plan for improving health and health care in Scotland. This set out how NHS Scotland's HEAT7 performance management system (based around a series of targets against which the performance of its individual Boards are measured) would feed into the Government's overarching objectives. A new HEAT target, introduced in 2009/10, also reflects this approach 8:
Achieve agreed number of inequalities targeted cardiovascular Health Checks during 2009/10
GPs and other primary care providers are increasingly attempting to identify people at risk of CVD and diabetes before the onset of any illness through the relevant domains in the Quality and Outcomes Framework 9 and on the basis of initiatives such as the Keep Well programme. 10 This aims to screen people aged 45-64 in deprived communities and offer advice and treatment where necessary. The latest SIGN Guidelines on cardiovascular health, 11 published in 2007, include a new risk assessment tool ( ASSIGN) which can be used to calculate a person's future risk of cardiovascular disease. ASSIGN, which is referenced in the draft standards on primary prevention of CVD in the NHS Quality Improvement Scotland clinical standards for CHD, differs from previous risk assessments by taking account of area deprivation as well as a range of lifestyle factors and family history. Since the Scottish Health Survey measures the same social and biological factors used by the ASSIGN tool, it is well placed to help NHS Scotland estimate the future prevalence of cardiovascular risk among its target groups. Biological measures will be reported in 2010 when the results of the data collected via the nurse visit are published. The Scottish Government's Better Heart Disease and Stroke Care Action Plan,12 launched in June 2009, has also adopted an anticipatory approach. This Plan sets out around 70 action points focused on the prevention of future health problems as well as improvements to treatment and long-term care for people with cardiovascular conditions.
These new policy initiatives build on work carried out by the previous Scottish Executive. The public health White Paper Towards a Healthier Scotland13 set a target to halve the rate of death from CHD and stroke in those aged under 75 in the 15 years between 1995 and 2010. The Coronary Heart Disease and Stroke Strategy for Scotland published in 2002 reiterated these targets, but by the time of its update in 2004 sufficient progress had been made for the CHD target to be increased to a 60% reduction by 2010. 14 As the 2009 Better Heart Disease and Stroke Care Action Plan12 sets out, the continued downward trend in CHD and stroke mortality suggests that these 2010 targets will be met. However, there is increasing concern that the overall rate of decline in CHD mortality has slowed considerably in recent years. The Chief Medical Officer's 2007 Annual Report suggests that this is likely to be a result of the increasing prevalence of risk factors such as obesity and diabetes and that future CHD mortality in Scotland is likely to be negatively affected by such trends. 10
While CVD and diabetes have obvious major consequences for individuals, there are significant implications for NHS resources. Although there has been a decrease in the numbers with CVD visiting their GP over the past few years, relatively high prevalence in the population continues to place significant demand on services. An estimated 177,000 patients with CHD15 and 46,000 patients with stroke or transient ischaemic attack 16 visited their GP or practice nurse in 2007-08 and CHD and stroke are two of the major causes of admission to Scottish hospitals. Furthermore, diabetes care is estimated to account for 10% of NHS expenditure in Scotland. 3
This chapter reports the prevalence of self-reported CVD conditions and diabetes and examines the patterns of these by socio-demographic characteristics. Trends in specific conditions in 1995, 1998, 2003 and 2008 are described and the relationship between various risks factors and CVD is also investigated.
8.2 METHODS AND DEFINITIONS
8.2.1 Methods
Participants were asked whether they suffered from any of the following conditions: angina, heart attack, stroke, heart murmur, irregular heart rhythm, 'other heart trouble', diabetes and (if they responded affirmatively) whether they had ever been told they had the condition by a doctor. For the purpose of this report, participants were classified as having a particular condition only if they reported that the diagnosis was confirmed by a doctor. Those participants who reported having a particular condition were also asked if they had it in the last 12 months. Women whose diabetes occurred during pregnancy with no subsequent diagnosis after this were excluded from the classification. No distinction was made between type 1 and type 2 diabetes in the interview but it is possible to estimate this by examining the age of onset of the condition and whether a participant was on insulin therapy at the time of interview. 17 This classification will be applied in future reports when diabetes is examined in more detail; this chapter only presents data for both types of the condition combined.
8.2.2 Summary measures of cardiovascular disease and diabetes
Any CVD condition / Any CVD condition or diabetes
Participants were classified as having any CVD condition if they reported ever having any of the following conditions confirmed by a doctor: angina, heart attack, stroke, heart murmur, abnormal heart rhythm, or 'other heart trouble'. It should be noted that in common with the definition used in the 2003 report, diabetes and high blood pressure are not included in this definition of 'any CVD condition' (as they had been in 1995 and 1998), since they are risk factors for CVD. A second definition that includes diabetes as well as the above CVD conditions is also presented in the tables as 'any CVD condition or diabetes' so that the total prevalence of these conditions can be seen. Blood pressure will be reported on separately in 2010. The trend table reports the prevalence of any CVD, based on the definition introduced in 2003, and any CVD or diabetes, in 1995, 1998, 2003 and 2008.
Ischaemic heart disease
Participants were classified as having IHD if they reported ever having angina, or a heart attack, confirmed by a doctor.
Ischaemic heart disease or stoke
Participants were classified as having IHD or stroke if they reported ever having angina, or a heart attack, or a stroke, confirmed by a doctor.
8.3 PREVALENCE OF CARDIOVASCULAR CONDITIONS AND DIABETES
This section reports the prevalence of doctor-diagnosed cardiovascular conditions and diabetes in 2008. The prevalence figures for men and women, for each condition, are summarised in the table below. The most commonly diagnosed conditions among men were abnormal heart rhythm and diabetes (5.3% for each). At 6.0% abnormal heart rhythm was also the most common condition among women, followed by angina and heart murmur (both 4.6%). 'Other' heart trouble (diagnoses that did not correspond with any of the other conditions in the table) was the least common for both men and women (2.1% for each).
Angina |
Heart attack |
Heart murmur |
Abnormal heart rhythm |
Other heart trouble |
Stroke |
Diabetes (types 1 & 2) |
Any CVD |
Any CVD or diabetes |
|
|---|---|---|---|---|---|---|---|---|---|
Men |
4.9 |
4.0 |
3.1 |
5.3 |
2.1 |
2.5 |
5.3 |
15.1 |
18.2 |
Women |
4.6 |
2.4 |
4.6 |
6.0 |
2.1 |
2.8 |
4.1 |
15.5 |
18.2 |
8.3.1 Angina
The prevalence of doctor-diagnosed angina was similar in both sexes: 4.9% of men and 4.6% of women reported that they had ever had angina with more than half being diagnosed in the previous 12 months (3.0% and 2.8% respectively). No-one under the age of 35 years had been diagnosed with angina. Otherwise, prevalence increased with age in both men and women aged 35 and over, with 1 in 5 men (20.4%) and 1 in 6 women (16.7%) over the age of 75 years reporting that they had ever been diagnosed with angina by a doctor.
8.3.2 Heart attack
The prevalence of heart attack was higher in men than in women: overall 4.0% of men and 2.4% of women reported that they had ever been diagnosed by a doctor with a heart attack. The proportion of those diagnosed in the past 12 months was much lower at all ages for both sexes (0.5% of men and 0.4% of women). The prevalence increased with age for both sexes. No heart attacks were reported by men or women aged under 35, just 0.2% of men and 0.5% of women aged 35-44 reported that they had experienced a doctor-diagnosed heart attack and this increased sharply to 15.5% of men and 9.8% of women aged 75 and over.
8.3.3 Stroke
Doctor-diagnosed stroke had a similar prevalence in men and women, with 2.5% of men and 2.8% of women reporting this condition. Only 0.3% of men and women reported having received a diagnosis of a stroke in the past 12 months. The difference in the rates of diagnosis varied by sex across age groups with no clear pattern, although men aged 75 and over were more likely to report that they had ever had a stroke than women (13.6% and 10.4% respectively). The prevalence of stroke increased with age among both sexes. Among men, angina and heart attacks were more commonly reported than stroke in those aged 45 and over; in the 35-44 age group stroke was more frequently diagnosed although the overall levels were low (1.3% reported a stroke in this group). Among women, the prevalence of strokes was slightly higher than for heart attacks at all ages, whereas angina was more commonly reported than stroke in those aged 55 and over.
8.3.4 Heart murmur, abnormal heart rhythm and 'other' heart trouble
The prevalence of heart murmur was higher in women than in men: 4.6% of women and 3.1% of men reported a diagnosis of this condition. Prevalence increased with age for men above the age of 45 and for women above the age of 25 (the proportions among men aged under 45 fluctuated with no clear pattern). The proportion reporting this condition was relatively high among the younger age groups, with 4.0% of men and 4.8% of women aged 16-24 years having a diagnosis of heart murmur (though note that the sample sizes for these age groups are smaller than for other ages so the estimates will be subject to wider confidence intervals).
The highest prevalence for any of the CVD conditions was reported for abnormal heart rhythm for both men (5.3%) and women (6.0%). About half of these diagnoses had been made in the past 12 months. Prevalence of abnormal heart rhythm increased with age in men and women, from 1.7% at age 16-24 to 13.5% at age 75 and over among men and from 1.5% to 11.4% of women in the corresponding age groups. In addition, abnormal heart rhythm was the second most prevalent condition in the younger age groups, after heart murmur.
Any other reported heart conditions that did not correspond to the categories reported above were combined and classified as 'other' heart trouble. Among both men and women, 2.1% reported that they had been diagnosed with 'other' heart trouble; 1.0% of men and 1.4% of women had received this diagnosis in the past 12 months.
8.3.5 Diabetes
More men than women had been diagnosed with type 1 or type 2 diabetes (5.3% and 4.1% respectively). Prevalence of this condition rose with age, most notably from the age of 45 in men and from 25 onwards among women. 4.1% of men aged 45-54 had diabetes compared with 16.1% of those aged 75 and over. The corresponding figures for women were 2.7% and 9.1%. Table 8.1
8.3.6 Any cardiovascular condition
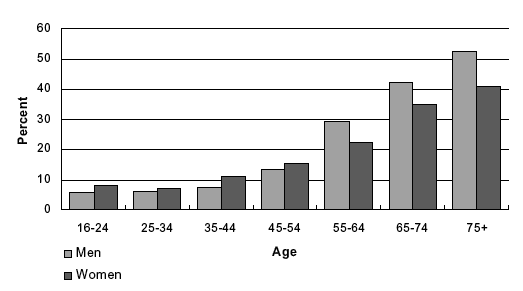
The prevalence of any doctor-diagnosed cardiovascular condition was similar for men (15.1%) and women (15.5%). Though as mentioned above, men reported a higher prevalence of heart attack and angina, whereas women were more likely to have received a diagnosis of stroke, heart murmur and abnormal heart rhythm. There was a marked increase in the prevalence of CVD with age for both sexes; this pattern was more evident from the age of 35 onwards while the rate of increase was particularly sharp among those aged 55 and over (see Figure 8A). In men the prevalence rose from 4.9% in those aged 16-24 to 45.0% in the 75 and over group. The increase was not as marked in women; 5.7% aged 25-34 compared with 35.5% aged 75 and over reported doctor-diagnosed CVD. It is important to note that women below the age of 55 years tended to report higher CVD prevalence rates than men in the corresponding age groups, but after this age the prevalence of CVD was significantly higher in men.
8.3.7 Any CVD or diabetes
Among men and women, 18.2% reported that they had doctor-diagnosed CVD or diabetes. In men this increased with age, particularly between the ages of 35-44 and 75 and over (7.3% and 52.5% respectively). In women this increase with age was less pronounced: 10.8% of those aged 35-44 compared with 40.8% aged 75 and over reported having CVD or diabetes. It is also worth nothing that among the younger age groups prevalence was relatively high compared with the levels for the individual conditions: 5.7% of men and 8.1% of women aged 16-24 had received a diagnosis of CVD or diabetes from a doctor. Table 8.2, Figure 8A
Figure 8A Prevalence of any CVD or diabetes by age and sex
8.3.8 Ischaemic heart disease ( IHD)
The prevalence of ischaemic heart disease (heart attack or angina) was 6.9% in men and 5.6% in women. The prevalence increased markedly with age for both sexes, with a nine-fold increase reported from the age of 45-54 years (3.0% in men and 2.4% in women) to 75 years and over (26.8% in men and 20.2% in women).
8.3.9 IHD or stroke
8.7% of men and 7.5% of women had received a diagnosis from a doctor of heart attack, angina or stroke. Prevalence of these conditions increased with age: from 1.8% of men and 1.6% of women aged 35-44 to 35.9% of men and 26.7% of women aged 75 and above.
8.4 CVD AND DIABETES BY SOCIO-DEMOGRAPHIC FACTORS
This section reports differences in the prevalence of any CVD, any CVD or diabetes, IHD, and IHD or stroke by socio-economic classification ( NS-SEC of the household reference person), equivalised household income and the Scottish Index of Multiple Deprivation (for descriptions of each of these measures please refer to the Glossary at the end of this volume). To ensure that the comparisons presented in this section are not confounded by the different age profiles of the sub-groups, the data have been age-standardised (for a description of age-standardisation please refer to the Glossary). On the whole the differences between observed and age-standardised percentages are small. Therefore, the percentages and means presented in the text below are standardised. The tables report both the observed and the age-standardised figures.
8.4.1 Socio-economic classification ( NS-SEC)
Any CVD / Any CVD or diabetes
The prevalence of any CVD condition, or any CVD or diabetes, was not associated with the NS-SEC of the household reference person for either sex. For example, Table 8.3 demonstrates that, among men, the age-standardised prevalence of any CVD was the same (around 14%) in the first three categories, and was only slightly higher among those in lower supervisory and technical households (17.0%), and semi-routine and routine households (15.6%). Among women the age-standardised prevalence was very similar in all groups (around 15%) and was slightly higher among those in small employer and own account worker households (18.3%).
IHD / IHD or stroke
In contrast to the pattern observed for CVD, NS-SEC was associated with the prevalence of doctor-diagnosed IHD or stroke. The highest rates of IHD, and of IHD or stroke, were found among men and women living in lower supervisory and technical, and semi-routine and routine households. Rates were generally lowest among those in professional and managerial households. For example, 5.3% of women in managerial and professional households reported IHD or stroke compared with 9.3% of those in lower supervisory and technical households and 9.6% in semi-routine and routine households. The corresponding figures for men were 6.6%, 10.0% and 10.5%. Table 8.3
8.4.2 Equivalised household income
Any CVD / Any CVD or diabetes
As shown in Table 8.4, among men the age-standardised prevalence of CVD, and CVD or diabetes, increased as equivalised household income decreased: 11.9% of those in the highest income quintile reported that they had CVD or diabetes compared with 21.0% in the lowest income quintile. However, it is important to note that the differences between the CVD or diabetes prevalence in men in the four lower quintiles were relatively slight, with prevalence ranging from 18.4% to 21.0%. Among women, the difference in prevalence reported between the highest and lowest income groups was not as great as that observed among men. Women in the highest two income quintiles reported the lowest age-standardised prevalence of CVD or diabetes (17.3% and 14.8% respectively). The rates of CVD or diabetes then rose and were higher in the remaining three income quintiles (21.2%, 21.9% and 22.6% in the 3 rd, 4 th and 5 th quintiles respectively).
IHD / IHD or stroke
In both men and women, the prevalence of doctor-diagnosed IHD or stroke tended to increase as income decreased, although proportions were similar in the 3 rd and 4 th quintiles. The difference between the highest and lowest income groups was greater for IHD or stroke than that observed for CVD or diabetes. This was particularly so among women: the age-standardised prevalence of IHD or stroke ranged from 2.5% in the highest income quintile to 11.1% in the lowest,. The corresponding figures for men ranged from 4.6% to 12.2%. Table 8.4
8.4.3 Scottish Index of Multiple Deprivation ( SIMD)
Two measures of SIMD are being used throughout this report. The first, which uses quintiles, enables comparisons to be drawn between the most and least deprived 20% of areas and the intermediate three quintiles and helps to assess the extent of any inequalities in behaviours or outcomes. The second contrasts the most deprived 15% of areas with the rest of Scotland (described in the tables as the "85% least deprived areas"). The most deprived 15% of areas have been identified as of particular concern by Scottish Government and are the subject of a number of policy initiatives. The Scottish Health Survey is designed to provide a large enough sample in the SIMD 15% areas after four years to enable robust detailed analysis at this level.
Any CVD / Any CVD or diabetes
The age-standardised prevalence of any CVD, and CVD or diabetes, was higher in the more deprived areas compared with the less deprived areas for both men and women, although no consistent gradient was evident across the five SIMD quintiles. The age-standardised prevalence in men of any CVD or diabetes was 15.9% and 16.1% in the 5th and 4 th (least) deprived quintiles, respectively, and ranged between 19.8% and 20.4% in the remaining three. The pattern was similar for women, with the highest age-standardised prevalence of CVD or diabetes reported by those in the 2 nd and 1 st (most) deprived quintiles (19.9% and 20.9%) compared with between 16.0% and 17.8% in the remaining three. The differences between those in the most deprived 15% of areas and the rest of Scotland were generally smaller than across the quintiles (17.3% versus 14.9% for any CVD among men, and 18.0% and 15.2% among women). The equivalent figures for CVD or diabetes were 19.3% and 18.1% for men, and 20.8% and 17.9% for women).
IHD / IHD or stroke
Among men and women, there was a linear increase in the age-standardised prevalence of doctor-diagnosed IHD or stroke as the level of deprivation increased. Men and women in the most deprived areas reported rates of IHD or stroke that were two times higher than for those living in the least deprived areas: in men the prevalence of IHD or stroke in the least deprived areas was 5.1% compared with 12.7% in the most deprived areas. The corresponding figures for women were 4.1% and 10.6%. The smaller differences between the prevalence in the most deprived 15% of areas and the rest of Scotland (12.3% and 8.3% for men, 10.3% and 7.1% for women) therefore mask the extent of the deprivation gradient with IHD or stroke. Table 8.5
8.5 FACTORS ASSOCIATED WITH ANY CVD
Multivariate logistic regression was used to estimate the independent effect of a range of factors associated with any CVD condition after each one had been adjusted for simultaneously. The factors investigated in the regression included a number of the behavioural characteristics explored in other chapters in this report, such as cigarette smoking, physical activity and BMI, as well as the key socio-demographic factors of age, SIMD quintile, equivalised household income and both parental and household NS-SEC. Two additional factors of interest to CVD were also included: diabetes and family history of CVD. Note that these models included a more limited set of factors than has been the case in previous reports due to the absence of nurse data for most of the participants. Important CVD risk factors such as high levels of HDL-cholesterol and high blood pressure will be explored further in future years once the nurse sample is sufficiently large. The regression was run separately for men and women, and the factors found to be significant are discussed below. For more information about logistic regression models and how to interpret their results see the Glossary at the end of this volume.
The odds ratios of having any CVD condition among selected sub-groups for men and women are shown in Table 8.6. An odds ratio of less than one means that the odds of a given group having CVD are lower than that of the reference category. The opposite is true when the odds ratio is greater than one. Independent variables with a 'p' value of 0.05 or less are significant predictors of the dependent variable at the 95% confidence level. The table demonstrates that the odds of reporting any CVD condition increased significantly with age from 55 years onwards, with men and women over the age of 75 years having the highest odds of having CVD (9.84 and 5.17 respectively) compared with the reference category (those aged 16-24).
Cigarette smoking was significantly associated with CVD for both men and women. Among men, the odds of having any CVD condition were 1.69 times higher among ex-regular smokers than among those who have never smoked. The odds of women who were current smokers having CVD were 1.46 times higher than those who had never smoked. There was also a significant association between diabetes and having any CVD condition for both sexes. Men with diabetes had odds 1.80 times greater than men without diabetes of reporting that they had CVD. The corresponding odds ratio for women was 1.84.
There was a significant association between reported physical activity levels and having any CVD condition in women only. Compared with women who were classified as having high activity levels (30 minutes a day at least 5 days a week) the odds of having CVD were higher among women with medium and low activity levels (odds ratios of 1.48 and 1.83 respectively). It is likely that a degree of reverse causation exists in relation to CVD and physical activity levels as those with a diagnosis might have decreased their activity as a result of their condition. This kind of analysis can only establish associations between risk factors, it cannot ascertain the direction of causation. However, other evidence does suggest that low physical levels can contribute to the onset of CVD over a lifetime. 18
Overall, equivalised household income was significantly associated with having CVD in women only. The odds of having CVD increased as household income decreased. Table 8.6
8.6 FACTORS ASSOCIATED WITH IHD OR STROKE
Further logistic regression was also used to explore the factors associated with IHD or stroke for men and women aged 35 and over. The same independent variables as were used in the CVD regression were included in the IHD or stroke model. The factors which were found to be significant, and were different to those found for any CVD condition, are discussed in detail below.
As with the analysis of any CVD condition, age, cigarette smoking status and diabetes were all significantly associated with IHD or stroke in both men and women. In addition, income was significant for women but not for men. The additional factors found to be significant in relation to IHD or stroke were SIMD quintile and physical activity level for men.
Levels of IHD or stroke in men increased as levels of deprivation increased. Men in the most deprived quintile had odds of reporting IHD or stroke 2.18 times greater than those in the least deprived quintile.
Physical activity levels and having IHD or stroke were significantly associated for both men and women; as mentioned above this association was only observed for women in relation to any CVD. Both men and women with low physical activity levels had significantly higher odds of reporting IHD or stroke than those with high physical activity levels (odds ratios of 2.15 and 3.21 respectively). Table 8.7
8.7 TRENDS OVER TIME IN CVD AND DIABETES
This section reports findings from the 1995, 1998, 2003 and 2008 Scottish Health Surveys. It examines the trend over time in the prevalence of: any CVD, any CVD or diabetes, IHD, stroke, and IHD or stroke. It should be noted that due to the different sample designs used in earlier surveys, the 'total' column refers only to members of the population aged between 16 and 64 years.
8.7.1 Any CVD, and CVD or diabetes, 1995, 1998, 2003, 2008
The prevalence of any CVD in men was similar in 2008 and 2003 (9.9% and 9.7% respectively). As noted in the previous report, this represents a statistically significant increase in any CVD in men aged 16-64 since 1998 (when it was 8.1%). However, it is not possible to conclude on the basis of repeat cross-sectional data sources such as this whether this trend represents an overall increase in the incidence of CVD among men or whether it reflects improved survival rates for these conditions. The increase in the prevalence of any CVD among women aged 16-64 between 2003 and 2008 (from 8.9% to 10.7%) was not statistically significant. Looking at the combined prevalence for CVD or diabetes this has increased significantly in both men and women since 1995, which is largely accounted for by increasing levels of diabetes over time. Among men aged 16-64 the prevalence has increased from 9.4% in 1995 to 12.2% in 2008. Although the prevalence among women has fluctuated slightly over the four time points, the increase between the 2003 and 2008 levels (from 10.2% to 12.8%) is statistically significant.
It is important to note that although the prevalence of doctor-diagnosed CVD and CVD or diabetes in men aged under 35 has been increasing since the 1998 survey these increases are not statistically significant. Table 8.8
8.7.2 IHD, stroke, and IHD or stroke, 1995, 1998, 2003, 2008
In 2008 the prevalence of IHD and IHD or stroke in men and women aged 16-64 was very similar to previous survey years, the same was true of stroke among men. In contrast, the prevalence of stroke - while remaining very small overall - has increased each year among women (from 0.5% in 1995 to 1.2% in 2008). Table 8.8