The Scottish Health Survey 2008
The Scottish Health Survey 2008
6 PHYSICAL ACTIVITY
Louise Marryat
SUMMARY
- The physical activity questions collected details of people's participation in housework, manual work/gardening/ DIY, walking, sports and exercise in the last four weeks.
- The proportion of the population aged 16 to 74 participating in any physical activity for at least 15 minutes in the last four weeks increased from 80% in 1998 to 83% in 2008 in men, and from 80% to 82% in women aged 16 to 74. However, for both men and women, rates of participation were the same in 2003 and 2008.
- The proportions of men and women aged 16 to 74 meeting the physical activity recommendations (30 minutes of at least moderate exercise on most days of the week) increased significantly from 40% in 1998 to 46% in 2008 in men, and from 29% in 1998 to 35% in 2008 in women.
- From 2008, activities of 10-14 minutes duration are also being counted. Including activities of at least 10 minutes duration, in 2008 the most common activity type in the past 4 weeks among men was sports and exercise (54%), followed by heavy housework (47%) and walking (39%). For women, the most common activity type was heavy housework (63%) followed by sports and exercise (45%) and walking (32%).
- 39% of adults aged 16 and over in 2008 met the physical activity recommendations, 45% of men and 33% of women. The Scottish Government's target is for 50% of adults to meet the recommendations by 2022. Men and women in the younger age groups were more likely to meet the recommendations than their older counterparts. Men in all age groups were consistently more likely to meet the recommendations than were women.
- Regression analysis was used to explore the relationship between a range of factors and the odds of meeting the physical activity recommendations. The odds of men and women being highly active decreased with age, increased with equivalised income, were lower among those who were overweight or obese, and were also associated with socio-economic classification. In addition, area deprivation was significant for men, and parental socio-economic classification was significant for women.
6.1 INTRODUCTION
The health benefits of a physically active lifestyle are well documented and there is abundant evidence that regular activity is related to a reduced incidence of chronic conditions such as cardiovascular disease, obesity, and type 2 diabetes. 1 Increased physical activity and the associated increases in physical fitness can reduce the risk of illness and premature death in overweight and obese people regardless of weight loss. 2 The World Health Organisation has estimated that physical inactivity was responsible for 22-23% of coronary heart disease, 16-17% of colon cancer, 15% of diabetes, 12-13% of stroke and 11% of breast cancer in developed countries. 3 Other estimates, based on UK data, suggest that as much as 37% of coronary heart disease in the UK is attributable to physical inactivity. 4 In Scotland it has been estimated that an increase of 5% in the proportion of adults participating in physical activity could prevent 157 premature deaths over five years and that the cumulative total life years saved would amount to 2,839 years. 5 The economic gain associated with the number of life years saved due to preventing these deaths is estimated to be £85.2 million. 6 The evidence fits with the economic benefit of physical activity programmes in the primary prevention of chronic disease. 7,8
Following the documented high prevalence of inactivity in Scotland, 9 and in response to a commitment made in the 1999 White Paper Towards A Healthier Scotland, 10 a Physical Activity Task Force ( PATF) was launched in 2001. In the 2003 PATF publication Let's Make Scotland More Active: A strategy for physical activity6 it was recommended that adults should accumulate at least 30 minutes of moderate activity on most days of the week (this can be accumulated in shorter bouts of as little as 10 minutes). The strategy set out the following target:
50% of adults should be meeting the current recommended levels of physical activity by the year 2022
A five year review of Let's Make Scotland More Active, conducted in 2008, 11 found no reason to make significant revisions to the strategy and recommended a continuation of it, noting that the guidelines in Scotland correspond with those recommended by the WHO and EU. The review also suggested that the results of the Scottish Health Survey should be used to identify whether any additional steps need to be taken to help achieve the target.
A number of the Scottish Government's National Performance Framework national indicators, 12 as set out in Chapter 1 of this Report, are focussed on increasing physical activity, for example:
Increase the proportion of journeys to work made by public or active transport
Increase the proportion of adults making one or more visits to the outdoors per week
The Better Health, Better Care Action Plan (2007), 13 the Scottish Government's strategy for a healthier Scotland, outlines how funding will be allocated in order to help address obesity through dietary and physical activity programmes. The importance of developing safe, sustainable places to provide opportunities for walking, cycling and other related activities is also noted.
The Scottish Government published Healthy Eating, Active Living: An action plan to improve diet, increase physical activity and tackle obesity (2008-2011) in 2008. 14 This document states that over £56 million will be spent in the period 2008-11 on activities aimed at improving dietary habits and physical activity levels, as well as promoting healthy weight. Specifically, the action plan also reports that the amount of money allocated to promoting physical activity has been doubled to £12 million, with a concomitant impact on initiatives such as Paths to Health, 15 which allows people to participate in volunteer-led walks on a weekly basis. In addition, the Scottish Physical Activity and Health Alliance ( PAHA), 16 a joint initiative of the Scottish Government and NHS Health Scotland, provides a focus for action to implement Scotland's physical activity strategy. It is hoped that the Commonwealth Games taking place in Glasgow in 2014, and initiatives associated with it, will serve as a catalyst which will influence the attitudes and behaviour of the Scottish population in relation to physical activity. 17 Previous Scottish Health Surveys show that meeting recommended levels of physical activity is associated with higher income 6 and with higher social class in men. 18, 19 The Scottish Government's commitment to reduce health inequalities, as set out in Better Health, Better Care and Equally Well, the report of the Ministerial Taskforce on Health Inequalities, 20 is also reflected in Healthy Eating, Active Living. For example, over two-thirds of the Paths to Health schemes are located in deprived communities and initiatives to promote physical activity in primary care settings via "exercise referral" schemes are being trialed.
The Scottish Health Survey is the main instrument by which progress towards physical activity targets are assessed. Physical activity is defined as bodily movement that results in the expenditure of energy. This chapter reports physical activity levels for adults. It presents participation in a range of different types of physical activities, as well as summary measures based on all types of activities. The summary measures are used to determine the proportion of the population who meet the Scottish Government's recommended levels of physical activity. The kinds of physical activity included in this study were not limited to participation in sports and structured exercise, but also covered other forms of activity which people may engage in as part of their daily lives, for example walking, housework or a physical job.
6.2 METHODS
6.2.1 Adult physical activity questionnaire
The adult physical activity module is based on the Allied Dunbar National Fitness Survey, a major national study of activity carried out in 1990. 21 A very similar questionnaire was used in both the 1998 and 2003 Scottish Health Surveys, and the 1997 and 1998 Health Surveys for England ( HSE). The dimensions of physical activity examined are the time spent being active, the intensity of the activity undertaken and the frequency with which it is done.
The 2003 questionnaire introduced new measures of physical inactivity, namely time spent sitting in front of a television, computer, or video-game screen; these were repeated in 2008. In addition, new questions were added in 2008 to assess the extent to which people make use of outdoor spaces for their physical activity. In previous years the minimum duration of participation in activities was set at 15 minutes. However, as the recommendations state that activity can be accumulated in bouts as short as 10 minutes the questionnaire was changed in 2008 to also include activities of 10-14 minutes duration.
The following table illustrates the impact on the 2008 estimates of widening the definition to include activities of 10-14 minutes. The impact of the change was relatively small overall; 45% of men met the recommendations based on the 10 minute definition compared with 44% with the 15 minute definition. The equivalent figures for women were 33% and 32%, respectively. The changes within different age groups were similarly small; the maximum increase was just two percentage points. However, the impact of the change will be greater for certain activities. For example, walking and exercises such as press-ups are more commonly carried out in short bursts of around 10-14 minutes than activities such as heavy DIY or manual work. The trend data in this report is based on the 15 minute definition to enable comparisons to be made between the 1998, 2003 and 2008 data. From 2009 onwards the trends will be based on the 10 minute definition and will take 2008 as the baseline for the time series. The detailed analysis of the 2008 data by age, sex and by socio-demographic groups presented in this chapter is based on the 10 minute definition.
% Meeting physical activity recommendations |
||||||||
|---|---|---|---|---|---|---|---|---|
Duration of activities |
16-24 |
25-34 |
35-44 |
45-54 |
55-64 |
65-74 |
75+ |
Total |
Men 15 minutes |
57 |
62 |
51 |
42 |
36 |
21 |
13 |
44 |
Men 10 minutes |
58 |
63 |
53 |
43 |
37 |
21 |
13 |
45 |
Difference |
+1 |
+1 |
+2 |
+1 |
+1 |
- |
- |
+1 |
Women 15 minutes |
40 |
41 |
42 |
35 |
29 |
20 |
4 |
32 |
Women 10 minutes |
42 |
42 |
43 |
37 |
29 |
20 |
4 |
33 |
Difference |
+2 |
+1 |
+1 |
+2 |
- |
- |
- |
+1 |
6.2.2 Adult physical activity definitions
Types of activity
Four main types of physical activity were asked about in the questionnaire:
- Home-based activities (housework, gardening, building work and DIY);
- Walking;
- Sports and exercise; and
- Activity at work.
With the exception of activity at work, participants were asked to report activities lasting at least 10 minutes and to say on how many days in the previous four weeks they had engaged in such activities. For walking, participants were also asked on how many days they had taken more than one walk of at least 10 minutes. If they had taken more than one walk a day, the total time spent walking on that day was calculated as twice the average time taken for a walk.
Those in full-time or part-time employment were asked to rate the extent to which they were physically active in their job using the following scale: very physically active, fairly physically active, not very physically active, not at all physically active. Responses to this question were taken into account for the estimation of the summary activity levels. Occupational activity was counted as 20 days in the last four weeks for full-time workers and 12 days in the last four weeks for part-time workers.
Participants were also asked to estimate the number of hours they spent sitting in front of a television or computer screen on an average weekday and at weekends. Time spent sitting at a screen at work, school or college was not counted.
Intensity level
Each activity mentioned was classified according to its intensity level, based on its estimated energy costs. The four levels of classification used were:
- Vigorous;
- Moderate;
- Light; and
- Inactive.
For home-based activities participants were given examples of types of housework, gardening, building work and DIY which were described as 'heavy' and 'light'. All examples of heavy housework, gardening, building work and DIY were classified as 'moderate'. Light gardening, building work and DIY were classified as 'light'. Light housework was not taken into account in this report. 22
For walking, participants were asked to assess their usual walking pace. Walks of 10 minutes or more at a 'brisk' or 'fast pace' were classified as 'moderate'. Walks at a 'slow' or 'steady average' pace were classified as 'light'.
Sports and exercise were classified according to the nature of the activity, and on the participant's own assessment of the amount of effort involved in doing that activity. For example, all instances of playing squash were counted as vigorous, whereas 'swimming' was only counted as 'vigorous' if the effort was usually enough to make the participant 'out of breath or sweaty', otherwise it was 'moderate'. 23
A combination of factors was used to classify activity at work. Each person's response to the question about how active they are in their job was combined with the Standard Occupational Classification ( SOC) code assigned to their job type. For example, participants who said that they were very physically active in their jobs were only classified as doing 'vigorous' activity at work if their job was one of a short list of particularly strenuous occupations; otherwise they were classified as 'moderately active' at work. 24 This classification was used for the calculation of the summary physical activity levels variable, it is not reported separately.
This chapter focuses on moderate and vigorous intensity activities. Therefore all results refer to participation in heavy housework, gardening, building work and DIY, and walking at a 'fairly brisk' or 'fast pace'. As discussed above, sports and exercise activities were classified as moderate or vigorous according to the nature of the activity, and on the participant's own assessment of the amount of effort involved in doing that activity.
6.3 TRENDS IN PHYSICAL ACTIVITY LEVELS, 1998, 2003, 2008
Table 6.1 presents data for the overall proportions participating in different activity types for at least 15 minutes in the last 4 weeks, by age and sex. As noted above, the figures for 2008 presented here differ from later results in this chapter. In this table only, activities have been included if they lasted for 15 minutes or longer in order to enable comparisons with the 1998 and 2003 results. The data presented in the rest of the chapter are based on activities of 10 minutes' duration or more, the trends reported from 2009 onwards will also be based on the new 10 minute definition. Also note that the time series comparisons here are based on data for adults aged 16 to 74, as people aged 75 or older were not included in the 1998 survey.
Some changes have been made to the way in which some of the sporting activities are classified which means that the 1998 and 2003 figures presented here differ to those published in the last report. The method used to estimate summary activity levels in the last report incorrectly classified some low intensity activities as moderate or vigorous which resulted in an overestimation of the proportion meeting the activity recommendations in 1998 and 2003. The difference between the original and revised estimates among the total population is not large. For example, the original estimate of the proportion meeting the recommendations in 2003 was 36% among all adults whereas the revised figure is 34%.
Over the last 10 years, there has been an increase for men and women in both the proportions meeting the recommendations and in overall levels of participation in physical activities. Starting with the former, both men and women aged 16 to 74 saw an increase of 6 percentage points in the proportions meeting the physical activity recommendations between 1998 and 2008: from 40% to 46% among men, and from 29% to 35% among women. Although the increases between 2003 and 2008 of 3 percentage points among women and 2 among men were not statistically significant (though they were on the margins of being so) the overall change over the decade since 1998 is significant.
The increase in the proportion meeting the recommendations occurred across all age groups among women, with the largest increases in the oldest groups. For example, 20% of women aged 55-64 met the recommendations in 1998 compared with 29% in 2008, while the increase among those aged 65-74 was even greater (from 8% to 20%). In contrast, the largest increases for men were among those aged 25-34 and 35-44, both of which saw rises of 10 percentage points meeting the recommendations. However, this trend was not evident among men aged 16-24; the proportion in this group meeting the recommendations has remained constant at 57% in each year. Table 6.1
In terms of the proportions participating in any physical activity, between 1998 and 2008 there was a rise of 3 percentage points in participation for men (from 80% to 83%) and a rise of 2 percentage points for women (from 80% to 82%). However, this disguises the fact that, for both men and women, rates of total participation were the same in 2003 and 2008. It might, at first glance, appear odd for the proportion meeting the recommendations to have increased more in every year than participation rates have. However, it is possible for the nature of people's activities to change without their overall participation rates to alter, for example if they switch from a low to moderate exertion activity, or if they increase the number of occasions on which they carry out an activity they have always done. The trend data here suggest that the increase in the proportions of men and women meeting the activity recommendations since 1998 has in part been a result of increased levels of participation in activities among some groups and also due to changes in the nature of the activities already engaged in among other groups. Table 6.1
6.4 PHYSICAL ACTIVITY IN 2008
This section looks in more detail at physical activity levels among adults in 2008.
6.4.1 Participation in different types of physical activity in the past 4 weeks
Table 6.2 shows the proportion of adults aged 16 and over who participated in any heavy housework, heavy manual work/gardening/ DIY, walking, sports and exercise, and overall activity for at least 10 minutes at a time in the last four weeks, together with the mean number of days they did so in the last four weeks and the mean number of hours per week (non-participation is counted as zero days and zero hours). Tables are shown separately for men and women. It should be noted that the number of days' participation is likely to over estimate the number of active days, as it assumes that each type of activity was done on a different day. So, for example, if someone had participated in heavy manual work/gardening/ DIY and walking on the same day, this would, in fact, be counted as two days of activity. As set out above, in contrast to previous Scottish Health Survey reports, activities lasting 10 minutes or longer are counted here, the 2003 report only included activities lasting 15 minutes or longer.
Any physical activity
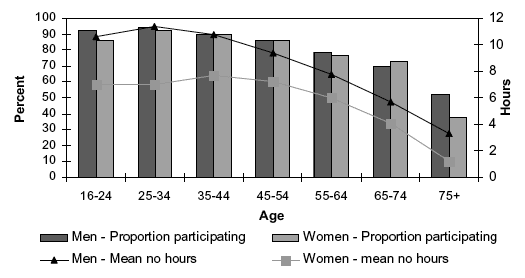
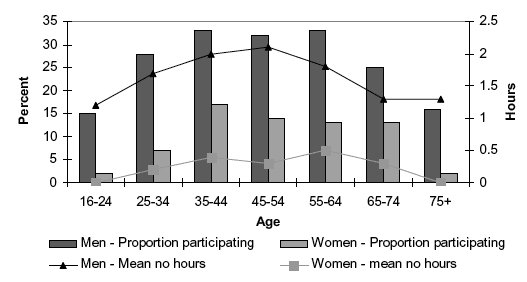
Men were slightly more likely than women to report participation in any physical activity for at least 10 consecutive minutes (83% compared with 80%). Men were also more likely than women to report, on average, more days of physical activity in the previous 4 weeks (mean 15.9 days for men, compared with 13.3 days for women). Furthermore, the mean number of hours of physical activity per week was higher for men at 9.1 hours, compared with 6.1 hours for women.
Participation in any physical activity was highest for men under 45 (ranging from 90% to 94%) and then fell with age, reaching 52% for men aged 75 and over. The mean number of days followed a similar pattern, ranging from a mean of 18.1 to 20.2 among the under 45s before again tailing off to 7.1 among those aged 75 and over. The average number of hours per week peaked for the 25 to 34 age group (mean 11.4 hours) before steadily falling to an average of 3.3 hours for men aged 75 and over.
Women followed a slightly different pattern, maintaining relatively steady physical activity levels until slightly later: participation ranged from 86% to 92% for those aged 16 to 54 before decreasing more notably to 73% of women aged 65-74, and to 38% for the 75 and over group. The average number of hours of physical activity per week also followed this pattern, staying steady for those aged 16 to 54 (a range of 7.0 to 7.7 hours on average), then decreasing to a mean of 4.1 hours for those aged 65-74 and 1.2 hours for those aged 75 and over. However, the average number of days of activity is more akin to the patterns for men's activity, peaking at age 25-34 with an average of 16.4 days, before steadily falling to 4.1 days for the 75 and over age group. Figure 6A, Table 6.2
Figure 6A Percent participating in any physical activity in the past four weeks (for at least 10 minutes), and mean number of hours per week, by age and sex
Heavy housework
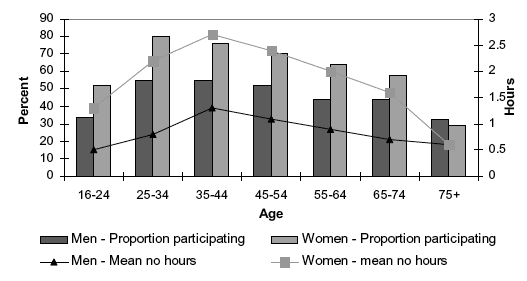
With the exception of those aged 16-24, heavy housework was by far the most common form of physical activity for women. Overall, 63% of women had participated in heavy housework, compared with 47% of men. For both men and women, participation in heavy housework peaked between the ages of 25 and 44 (for men at 55% and for women between 76% and 80%). Proportions then decreased for both sexes, though women's levels generally remained higher than men's. The mean number of days of heavy housework for women was also higher than for men, rising from 3.1 days for the 16-24 age group, to 5.5 for those aged 35-44, before steadily declining to an average of 1.6 days for women aged 75 and over. Patterns were similar for men; levels peaked in the 35-44 age group at 3.2 days before steadily falling to an average of 1.9 days in the oldest age group. The mean number of hours of heavy housework per week also showed a similar pattern, with women in all age groups participating for longer than men, rising from an average of 1.3 hours for women aged 16-24, to a peak of 2.7 aged 35-44 before steadily declining. Figures for men rose from an average of 0.5 hours per week in the 16-24 age group, to a peak of 1.3 hours at 35-44, before again declining. Figure 6B, Table 6.2
Figure 6B Percent participating in heavy housework in the past four weeks (for at least 10 minutes), and mean number of hours per week, by age and sex
Sports and exercise
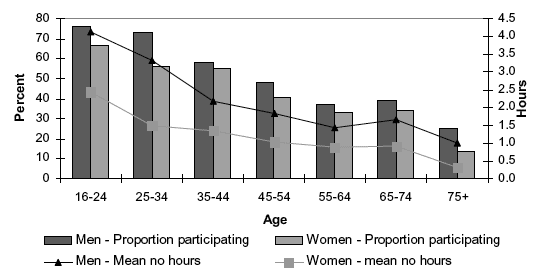
Sports and exercise was the most common form of physical activity for men, and in particular, for younger men. In the 16-24 age group, three-quarters (76%) of men participated in sport and exercise for at least 10 minutes in the past four weeks, before declining steadily with age to a quarter (25%) of men aged 75 or over. The corresponding figures for women were lower at 67% and 14%. Men were more likely than women to report participating in sport and exercise (54% of men compared with 45% of women) and this was true across all age groups. Men also participated in sport and exercise on more days on average, and for a greater period of time than women. Again, this peaked in the youngest age groups, with men aged 16-24 participating in sport and exercise on an average of 11.6 days in the past four weeks, compared with 8.8 days for women in the same age group. In terms of hours of participation, men aged 16-24 reported an average of 4.1 hours per week compared with 2.4 hours for women the same age. Hours declined as age increased with a similar, though not identical, pattern for both sexes. Men's hours declined sharply between the ages of 16 and 44 (from 4.1 to 2.2 hours per week), and continued to decline steadily with age to just 1 hour a week among those aged 75 and over. The apparent increase among the immediate post retirement group aged 65-74 was not statistically significant so should not be over-interpreted. Women's hours declined sharply between the ages of 16 and 34 (from 2.4 to 1.5 hours per week), and then ranged between 1.3 and 0.9 hours for those aged 35 to 64, with a further sharp drop to 0.3 hours after the age of 75. Figure 6C, Table 6.2
Figure 6C Percent participating in sport and exercise in the past four weeks (for at least 10 minutes), and mean number of hours per week by age and se x
Walking
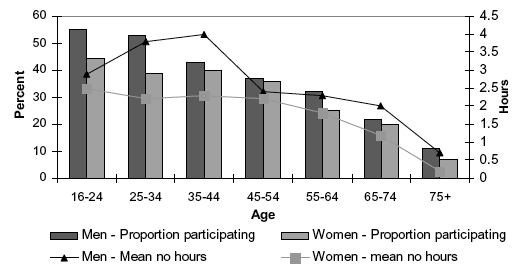
The third most common activity for both men and women was walking. Men were slightly more likely than women to have walked for at least 10 minutes in the last 4 weeks (39% compared with 32%); this pattern was true across all age groups.
Participation in walking peaked for both sexes in the youngest age group (55% of men and 44% of women aged 16-24 having walked for at least 10 minutes) and then followed a fairly linear decline with age. The average number of days on which people had walked for at least 10 minutes followed a similar pattern, though it started to fall at an earlier age for women than for men. Men walked on an average of around 10 days between the ages of 16 and 34, before falling to 8.2 days at age 35-44 and declining steadily to just 2.0 days at age 75 and over. Women aged 16-24 walked on an average of 9.1 days, but then fell to an average of 7.4 days in the next two age groups, and declined steadily from 6.3 days at age 45-54 to just 1.1 days at age 75 and over. The average number of hours spent walking per week followed a different pattern although, again, men walked more than women in each age group. Men aged 16-24 walked an average of 2.9 hours per week, rising to 4 hours at age 35-44, before decreasing gradually to 0.7 hours for those aged 75 and older. This would suggest that although men aged 16-24 had walked on more days in the past month than those aged 25 to 44, younger men spent less time walking on the occasions that they had walked. Women's patterns, on the other hand, remained rather more level at around 2.3 hours until the age of 55-64 and then decreased gradually to 0.2 hours for the 75 and older age group. Figure 6D, Table 6.2
Figure 6D Percent walking in the past four weeks (for at least 10 minutes), and mean number of hours per week, by age and sex
Heavy manual work/gardening/ DIY
Participation in heavy manual work, gardening or DIY, was much more common among men than women; 27% of men had participated in some in the last 4 weeks compared with 11% of women. Although the overall levels differed, the patterns of participation by age were similar for men and women. Men in the youngest (16-24) and oldest (75 and over) age groups were the least likely to have participated in these kinds of activity; 15% and 16%, respectively, had done so compared with between 25% and 33% of men in the intervening age groups. The highest participation rates, as well as the highest average days and hours of participation, were among men aged between 35 and 64. Women's overall participation levels in heavy manual work/gardening/ DIY followed a similar pattern, with just 2% of those aged 16-24 and those aged 75 and over having carried out any of these activities in the past four weeks, rising to 7% for the 25-34 age group and ranging between 13% and 17% in the remaining age groups. The average number of days in the last four weeks and hours per week were low for all age groups (less than 1 for both) and followed a similar pattern to that described for overall participation levels with the highest levels found among those aged between 35 and 74. Figure 6E, Table 6.2
Figure 6E Percent participating in heavy manual work/gardening/ DIY in the past four weeks (for at least 10 minutes), and mean number of hours per week, by age and sex
6.4.2 Summary physical activity levels
Table 6.3 presents the overall activity levels for men and women, by age. Men and women are separated into three groups of low, medium and high activity. Low levels indicate participation in fewer than 30 minutes of moderate or physical activity a week; medium levels indicate participation of 30 minutes or more on 1 to 4 days a week; and high levels indicate 30 or more minutes of moderate or vigorous activity on 5 or more days a week. Those whose activity levels are classified as 'high' can be counted as having met the current physical activity recommendations; the remainder of this chapter focuses mainly on this latter group.
Overall, 45% of men and 33% of women (aged 16 or over) met the current physical activity recommendations of at least 30 minutes of physical activity on 5 or more days a week. The figure for all adults is 39% (data not shown). Men and women in the younger age groups were more likely to meet the recommendations than their older counterparts. For men this peaked at 25-34, 63% of whom met the recommendations, before steadily declining to 13% among those aged 75 and older. The pattern for women was similar; 42-43% of those aged 16-44 met the recommendations and the proportion declined with age to just 4% of women aged 75 and older. The rate of decline between the two oldest age groups (65-74 and 75 and over) was greater for women than for men. However, as is clear from Figure 6F, despite similar patterns by age within both sexes, men in all age groups are consistently more likely to meet the recommendations than are women. The gap between the sexes is most marked up to the age of 34, with differences of between 16-21 percentage points, compared with 1-10 percentage points for older age groups. The Scottish Government's target is for 50% of adults to meet the recommendations by 2022; at present this target is only met by men aged 16 to 44 which suggests that significant efforts still need to be targeted at men aged 45 and over and at women if the overall target is to be met for both sexes.
28% of men and 33% of women had low activity levels overall, meaning that they participated in fewer than 30 minutes of exercise a week. Low physical activity levels also differed by age for both sexes, with a particularly marked increase in low activity levels in the age 75 and older group (66% of men and 78% of women in this age group have low activity levels, compared with 51% and 46% respectively at age 65-74). It is worth noting, however, that a quarter of women aged 16-24 also had low activity levels (in contrast to just 13% of men in this age group). Figure 6F, Table 6.3
Figure 6F Summary physical activity levels by age and sex
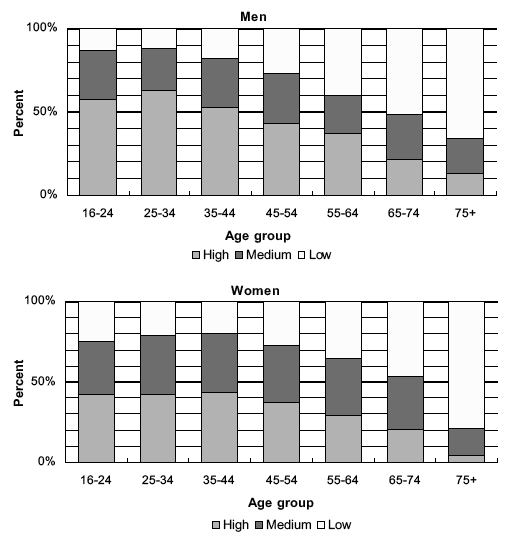
Note: The 50% line in the above chart is highlighted to illustrate progress towards the Scottish Government target for 50% of adults to meet the physical activity recommendations (activity levels classified as 'high') by 2022.
6.4.3 Physical activity levels by socio-demographic factors
Tables 6.4 to 6.6, present the proportions who met the current physical activity recommendations of at least 30 minutes of physical activity on 5 or more days a week by socio-economic classification ( NS-SEC of the household reference person), equivalised household income and the Scottish Index of Multiple Deprivation (descriptions of each of these measures are available in the Glossary at the end of this volume). Inequalities in the groups of people meeting the physical activity guidelines, and the consequences of this, are a particular concern for the Scottish Government. It is therefore important to determine whether the proportion meeting the recommendations differs across different groups. To ensure that any comparisons using these three factors were not confounded by the different age profiles of the sub groups, the data were age-standardised. The percentages presented in this section are all age-standardised, although the differences between the observed and age-standardised percentages were small. The tables present both age-standardised and observed figures.
Socio-economic classification ( NS-SEC)
The proportions meeting the activity recommendations varied by NS-SEC for both men and women but with no obvious pattern. Men in small employer and own account worker households were the most likely to have met the recommendations (55%) and men in intermediate households were the least likely to have done so (38%).
For women the pattern was slightly different; those in managerial and professional households, small employer and own account worker households and those in semi-routine and routine households were the most active (36%, 35% and 33% met the recommendations respectively). The corresponding proportions for the remaining two groups were 28% (intermediate households) and 29% (lower supervisory and technical households). Table 6.4
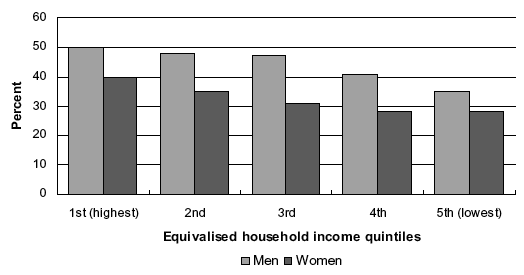
Equivalised income
A clear linear relationship exists between income levels and the likelihood of meeting the physical activity recommendations, with the proportions doing so declining with income. 50% of men and 40% of women in the highest income quintile households met the recommendations compared with 35% of men and 28% of women in the lowest income quintile. For men, the decrease was more pronounced from the 3 rd quintile onwards. However, for women, the pattern was reversed with the largest decrease occurring between the 1 st and 2 nd quintiles with a flattening of the decline evident in the 4 th and 5 th quintiles. Figure 6G, Table 6.5
Figure 6G Proportion meeting physical activity recommendations by equivalised household income quintile and sex
Scottish Index of Multiple Deprivation ( SIMD)
Two measures of SIMD are being used throughout this report. The first, which uses quintiles, enables comparisons to be drawn between the most and least deprived 20% of areas and the intermediate quintiles and helps to assess the extent of any inequalities in behaviours or outcomes. The second contrasts the most deprived 15% of areas with the rest of Scotland (described in the tables as the "85% least deprived areas"). The most deprived 15% of areas have been identified as of particular concern by Scottish Government and are the subject of a number of policy initiatives. The Scottish Health Survey is designed to provide a large enough sample in the SIMD 15% areas after four years to enable robust detailed analysis at this level.
Those living in the most deprived quintile were least likely to have met the activity recommendations (38% of men and 28% of women). However, among men there was no clear relationship between SIMD quintile and meeting the recommendations as the proportion was highest for those in the 3 rd quintile (51%) and similar in the remaining quintiles (at between 44-46%). For women, a clearer pattern was evident: at 39%, those in the least deprived quintile were the most likely to have met the recommendations, the proportions then dropped and levelled off in the middle quintiles to around 32% before dropping to 28% in the most deprived quintile.
Comparing those living in the 15% most deprived areas of Scotland with the rest of Scotland confirms that those in the most deprived areas stand out as less likely to have met the recommendations. The difference between the groups was greater for men than for women. The age-standardised proportions meeting the recommendations in the most deprived 15% of areas were 35% for men and 28% for women compared with 47% and 34% in the rest of Scotland, respectively. Table 6.6
6.5 PHYSICAL ACTIVITY LEVELS IN RELATION TO OBESITY
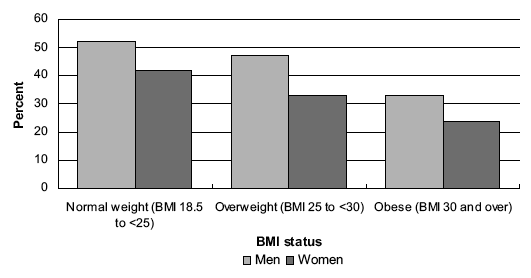
Physical activity levels are closely related to body weight, and in particular to the prevalence of overweight and obesity. 25, 26 Table 6.7 presents the proportions meeting the current physical activity recommendations, by body mass index ( BMI) status and sex. BMI is an indirect measure of adiposity, which takes into account height and weight; it is calculated as weight (kg) divided by height squared (m 2). The data is derived from the direct measurements of height and weight taken in the main interview. Participants were classified as underweight ( BMI < 18.5 kg/m 2), normal weight (18.5 to less than 25 kg/m 2), overweight (25 to less than 30 kg/m 2), and obese (30 kg/m 2 and over). See Chapter 7 for further analysis and discussion of BMI. Note that for this analysis the sample sizes for underweight men and women are too small to enable any firm conclusions to be drawn so the data for this group are omitted from the figure below.
For both men and women, those of normal weight were more likely to have met the physical activity recommendations than men and women who were overweight or obese. 52% of men with a normal weight met the recommendations, compared with 47% of overweight men and 33% of obese men. The corresponding figures for women were 42%, 33% and 24%. Figure 6H, Table 6.7
Figure 6H Proportion meeting physical activity recommendations by BMI status and sex
6.6 FACTORS ASSOCIATED WITH PHYSICAL ACTIVITY
Logistic regression was used to examine the association between physical activity levels and socio-demographic, behavioural and anthropometric factors. The dependent variable was meeting the current physical activity recommendations (participation in at least 30 minutes of moderate or vigorous physical activity at least five times a week). By simultaneously controlling for a number of factors, the independent effect each factor has on the variable of interest can be established. Logistic regression compares the odds of a reference category (shown in the table with a value of 1) with that of the other categories. For further details of this analysis technique see the Glossary.
Separate logistic regressions were run for men and women, and the following variables were found to be significant for both sexes: age group, BMI status, NS-SEC, and equivalised household income. In addition, SIMD was significant for men, and parental NS-SEC was significant for women.
The odds ratios are presented in Table 6.8. An odds ratio of less than 1 means that the odds of a given group meeting the recommended physical activity levels are lower than that of the reference category. The opposite is true when the odds ratio is greater than 1. Independent variables with a 'p' value of 0.05 or less are significant predictors of the dependent variable at the 95% confidence level.
Men and women aged 45 and over had significantly lower odds of meeting the physical activity recommendations compared with those aged 16-24. The odds ratios decreased with age and were lowest among those aged 75 and over (odds ratios of just 0.12 for men and 0.06 for women).
Compared with those with a BMI below 25 kg/m 2, the odds of meeting the recommendations were significantly lower for obese men (odds ratio of 0.75) and women (0.69).
Men and women in the 4 th and 5 th lowest household income quintiles had lower odds than those in the 1 st highest quintile of meeting the recommendations (odds ratios of 0.68 and 0.48 for men, and 0.65 and 0.69 for women, respectively).
Household NS-SEC was also associated with physical activity levels for both men and women.
For women, there was a relationship between parental NS-SEC at age 14 and meeting the physical activity recommendations; there was no such association for men. Women brought up in intermediate or own account worker households had significantly lower odds (0.52) of meeting the recommendations compared with those who were brought up in managerial or professional households, The equivalent odds ratio for those from routine and manual households was 0.67.
SIMD quintile was significantly associated with men's activity levels but not women's. Table 6.8