The Scottish Health Survey 2008
The Scottish Health Survey 2008
3 ALCOHOL CONSUMPTION
Susan Reid
- On average, men drank 18 units of alcohol per week and women drank 8.6 units per week. Among both sexes, weekly consumption was higher among younger age groups than among older people. Men's weekly units ranged between 17.8 and 23.5 units up to the age of 55-64 and declined thereafter to 13.8 units among men aged 65-74 and 8.3 units for those aged 75 and over. Women's weekly units were highest among those aged 16-24 (16.2 units) and ranged between 7.2 and 9.9 units among those aged between 25 and 64. It was lower again for those aged 65-74 and 75 and over (5.4 units and 2.7 units respectively).
- 30% of men reported their usual alcohol consumption as being more than the recommended limit of 21 units per week. For women, the proportion drinking more than the recommended limit of 14 units per week was 20%.
- Similar levels of men drank over 21 units per week up to the age of 55-64 (between 3 and 4 in 10), this then declined further to 25% of those aged 65-74 and 14% of those aged 75 and over.
- Patterns of exceeding weekly recommended limits were similar for women. 37% of those aged 16-24 drank over 14 units per week, this decreased to between 19% and 23% for the next four age groups (25-34 to 55-64), and dropped further to 12% of those aged 65-74 and to 4% of those aged 75 and over.
- The proportion of men drinking over the weekly recommended limit declined from 34% in 2003 to 30% in 2008. The equivalent figures for women were 23% and 20%, respectively. Although the overall decline in men's average weekly unit consumption was statistically significant it was at the very margin of being so. The decline for women was not significant. Further years of data will need to be collected before firm conclusions can be reached about weekly drinking trends.
- Among women, levels of weekly consumption were associated with a number of socio-demographic factors, such as socio-economic classification, household income and area deprivation. Levels of consumption were highest among women in managerial and professional households, in the highest income quintile and among those living in the least deprived areas.
- Weekly consumption above the recommended limits showed a different pattern among men and was not associated with socio-economic classification or area deprivation. Consumption levels were similar for the first three income quintiles while the lowest two groups were the least likely to have drunk over 21 units a week. The one exception to this pattern was that men in the most deprived areas were more likely than those in the least to drink very heavily (more than 50 units a week).
- Turning to daily consumption, 44% of men had drunk more than 4 units on their heaviest drinking day in the previous week and 27% said they drank more than 8 units (defined as 'binge' drinking), the mean units consumed were 6.2. Around a half of men aged between 16 and 54 drank more than 4 units on the heaviest drinking day compared with 14% of men aged 75 and over. The pattern was similar for more than 8 units; at least 3 in 10 men aged under 55 drank more than 8 units compared with just 2% of men aged 75 and over.
- Among women, 36% reported drinking more than 3 units on the heaviest drinking day in the past week, 18% drank more than 6 units (binge drinking) and the mean units consumed were 3.5.
- As with men, exceeding these levels was much more common among younger than older women. Women in the youngest age groups were the most likely to have consumed over 3 units on their heaviest drinking day (ranging from 45% to 54% among those aged between 16 and 44). Women aged 16-24 were the most likely to have consumed more than 6 units (41%) and their mean units were highest (7.1). All of these rates decreased with age so that by the age of 75 and over only 6% of women drank over 3 units, 1% drank over 6 units and mean daily consumption was just 0.7 units on the heaviest drinking day in the past week.
- Levels of daily consumption were very similar in 2003 and 2008. As with the weekly drinking trend figures, more years of data will be need to be collected before any clear patterns can be identified.
- The socio-demographics patterns for daily drinking did not always follow those for average weekly consumption, for example, socio-economic classification was not associated with daily consumption for either sex.
- In common with the results for weekly drinking, equivalised household income was significantly associated with mean daily consumption, exceeding recommended daily limits and binge drinking among both sexes. The mean units consumed and the proportions drinking more than 4 units (for men) or 3 units (for women) declined with income. The patterns were less pronounced for binge drinking. Around 3 in 10 men in the two highest quintiles drank over 8 units on the heaviest drinking day in the past week, while between 23% and 26% did so in the remaining groups. Among women, the highest age-standardised prevalence of binge drinking was found among those in the highest income quintile (24%), the corresponding figures for the rest of the income groups were very similar and ranged between 15% and 18%.
- Area deprivation was significantly associated with women's daily drinking patterns. For men, area deprivation was only associated with whether they had drunk at all in the previous week. Women in the least deprived quintile were the most likely to have consumed more than 3 units on the heaviest drinking day in the past week, while those in the most deprived areas were least likely (42% versus 31%, respectively). Mean daily units followed a similar pattern of 3.9 and 3.0 units in the least and most deprived areas. Binge drinking levels were similar across the quintiles.
- Regression analysis was used to explore the relationship between a range of factors and the odds of exceeding the daily limit for their sex. For both men and women, the odds decreased with age and increased with income. For men they were also higher in those who were brought up in intermediate occupation households. For women, the odds were lower for those from small employer and own account worker households.
- Potential problem drinkers are defined as agreeing with 2 or more of 6 items from a questionnaire designed to assess problem drinking behaviour; this applied to 15% of men and 9% of women. Problem drinkers were much more commonly found in the younger age groups for both sexes.
3.1 INTRODUCTION
Misuse of alcohol contributes to a wide range of health problems, including high blood pressure, chronic liver disease, pancreatitis, cancer, suicide, and accidents, as well as social problems such as antisocial behaviour including violent crime. The cost of alcohol misuse to Scottish society in 2006-7 was estimated at around £2.25 billion. 1 This figure includes costs to NHS Scotland (£405 million), social work services (£170 million), criminal justice and emergency services (£385 million), and wider economic costs, such as absenteeism, health problems and deaths among the working age population (£820 million). The human costs of deaths among the non-working age population were estimated at £470 million. Recent figures show that the burden of alcohol on NHS services and wider society is growing. For example, there was a 17% increase in discharges related to alcohol from general hospitals in Scotland between 2003/4 and 2007/8 evident for all age groups in the adult population 2 and deaths linked to alcohol have doubled in the past 15 years. 3
Estimates of alcohol consumption take two forms, those based on sales and those based on personal reports of consumption. Neither measure is perfect (not all alcohol that is purchased is consumed, some will be consumed outside Scotland, and not all consumption is reported), but there is increasing recognition that data from multiple sources are essential to help build up as complete a picture as possible of Scotland's relationship with alcohol. Figures based on sales data from the alcohol industry in Scotland indicate that almost 50 million litres of pure alcohol were sold in 2007. 2 The same report suggests this equates to 12.2 litres of pure alcohol sold per person over the age of 18 in Scotland. In contrast, the estimation for England and Wales is considerably lower at 10.3 litres per person. In unit terms the figures for Scotland equate to 1,219 units a year for every adult (18 years and over), equivalent to an average weekly consumption of 23.4 units a week for all adults. Consumption at this level exceeds the recommended weekly intake for men (see below), which is particularly concerning given that the adult population will include teetotallers and infrequent drinkers. It is perhaps unsurprising that Scotland's death rates from chronic liver disease and cirrhosis are much higher than those in England and Wales, and are increasing at a time when many countries are seeing declining rates. 4,5
Some of the alcohol-related adverse health outcomes, such as alcoholic liver disease, are associated most with sustained heavy drinking, 6 whereas some, such as cardiovascular events, may be linked with excessive drinking on one or more occasion. 7 Thus public health advice about alcohol consumption is framed in relation to sensible drinking guidelines.
The recommended sensible drinking guideline is that women should not regularly drink more than 2-3 units per day and men should not regularly drink more than 3-4 units per day. In addition, Government recommends that everyone should aim to have at least 2 alcohol free days per week. Over the course of a week, therefore, it is recommended that women and men should not exceed 14 units and 21 units respectively.
Analysis of alcohol-related hospital admissions among participants in the 1995, 1998 and 2003 Scottish Health Surveys (who consented to record linkage) shows that even moderate levels of weekly drinking are a risk factor for such admissions, though higher levels and binge drinking are particularly significant factors. 8
Although there is no standard definition of 'binge drinking' in the UK, Alcohol Concern recommends using the Office of National Statistics' definition of heavy drinking: 6 or more units for women and 8 or more for men on a single day. 9 To enable comparisons to be drawn with other major surveys of alcohol consumption in Great Britain, this report has adopted the binge drinking definitions which were also employed in the General Household Survey and the Health Survey for England which are: more than 6 units for women and more than 8 units for men.
Concerns about excessive drinking were outlined in the Scottish Executive's 2002 "Plan for Action on Alcohol", 10 its update in 2007, 11 and the Scottish Government's 2009 Framework for Action 3 (discussed below). There continues to be considerable concern about the health and social harm associated with a range of excessive drinking patterns, including 'binge drinking' and regular drinking above the daily benchmarks and weekly limits, as reflected in the Scottish Government's approach since 2007. One of the Scottish Government's National Performance Framework national indicators, 12 as set out in Chapter 1 of this Report, relates directly to alcohol:
Reduce alcohol related hospital admissions by 2011
In 2007 the Scottish Government published Better Health, Better Care,13 its action plan for improving health and health care in Scotland. This set out how NHS Scotland's HEAT14 performance management system (based around a series of targets against which the performance of its individual Boards are measured) would feed into the Government's overarching objectives. The HEAT target related to alcohol is:
Achieve agreed number of screenings using the setting-appropriate screening tool and appropriate alcohol brief intervention, in line with SIGN 74 guidelines by 2010/11
This approach involves a short, evidence-based, structured conversation about alcohol consumption with a patient/service user identified as displaying problem drinking behaviour. The conversation seeks to motivate and support the individual to think about and/or plan a change in their drinking behaviour in order to reduce their consumption and/or their risk of harm. This is in common with the anticipatory approach being increasingly adopted in primary care in relation to wider cardiovascular disease risk factors. A target has been set for carrying out nearly 150,000 brief interventions in the priority settings of primary care, antenatal care, and Accident and Emergency Departments between 2008/9 and 2010/11. 3
The steps being taken to help meet these objectives go beyond the confines of hospitals and other clinical settings. For example, the Licensing (Scotland) Act 2005, which comes fully into force in September 2009, includes measures to limit alcohol promotions in licensed premises. In March 2009 the Scottish Government published a response to its consultation undertaken in 2008 to tackle alcohol misuse in Scotland. The response: Changing Scotland's Relationship with Alcohol: A Framework for Action3 set out a package of measures to address issues around reducing alcohol consumption, tackling the damaging impact alcohol misuse has on families and communities, encouraging positive attitudes and positive choices, and improving the support and treatment available to tackle alcohol misuse.
The Scottish Government also established a Monitoring and Evaluation Reference Group for Alcohol ( MERGA), in order to oversee the development of a range of monitoring and evaluation studies which will measure the impact of the actions set out in the Framework for Action and the Licensing (Scotland) Act 2005. Ensuring that Scotland has robust evidence of alcohol consumption over time will be critical to the success of any attempts to evaluate impact. A number of concerns have been raised about the Scottish Health Survey's suitability for measuring trends in alcohol consumption due to its intermittent reporting. 11 This particular concern has been addressed by the fact the survey is now running continuously between 2008 and 2011. However, a more fundamental concern relates to the ability of surveys to capture alcohol consumption levels accurately. This extends beyond the known weaknesses typically associated with surveys such as social desirability biases and recall errors on the part of respondents. This additional concern focuses on the method for converting the amounts of alcohol participants report having consumed into units. 15 Recent increases in the typical strengths and serving size of alcohol products meant that some of the unit assumptions that were devised for use in the General Household Survey ( GHS), the Health Survey for England ( HSE) and the Scottish Health Survey ( SHeS) were outdated and, as a consequence, had contributed to the underreporting of alcohol consumption. To address this, in December 2007, the Office for National Statistics published updated conversion factors for converting drink volumes to alcohol units 16 and these are now being used to estimate alcohol consumption in these three surveys. This new method has now been adopted by the GHS and HSE and will also apply to the Scottish Health Survey 2008-2011. In addition, it was also possible to apply them to the alcohol data from the 2003 Scottish Health Survey to update those estimates. 17 This chapter therefore reports the data from the 2008 survey and compares it with the updated 2003 data. More details about this new method are set out below.
3.2 METHODS
3.2.1 Data collection
In the 2008 survey, alcohol consumption was measured in relation to three key aspects: usual weekly consumption, daily consumption on the heaviest drinking day in the previous week and indicators of problem drinking (including physical dependence).
The module of drinking questions in 2008 followed those used in 1998 and 2003. One noteworthy change was made in relation to the questions about wine consumption. In light of the growing concerns about the reliability of consumption estimates from studies such as this, and the increasing consumption of wine - especially amongst women - it was decided that these questions should attempt to capture the size of glass consumed more accurately. This was done in two ways. Firstly, participants who reported drinking any wine were asked directly what size of glass they had been drinking from. Secondly, showcards depicting glasses with 125ml, 175ml and 250mls of liquid were introduced to assist people when making their judgements about glass sizes. In addition, a new category of 700ml bottles was added to the questions about alcopops to reflect the fact that they are now commonly available in this volume.
To estimate weekly consumption, participants aged 16 and over were asked preliminary questions on whether they drank alcohol at all, followed by questions on how often during the past 12 months they had drunk each of six different types of alcoholic drink:
- normal beer, lager, cider and shandy
- strong beer, lager and cider
- sherry and martini
- spirits and liqueurs
- wine
- alcoholic soft drinks ("alcopops").
From this question, the average number of days a week the participant had drunk each type of drink was estimated. A follow-up question asked how much of each drink type they had usually drunk on each occasion. These data were converted into units of alcohol and multiplied by the amount they said they usually drank on any one day (see below for discussion of this process). 18
It is well known that surveys tend to underestimate adults' levels of alcohol consumption for a number of reasons, including problems of recall, social desirability, and the difficulties involved in assigning an average estimate to an activity that varies from day to day. 19 Also, as the questions ask about 'usual' behaviour, responses are unlikely to reflect occasions of heavier drinking. Nevertheless, survey estimates provide useful comparisons of the consumption of different population groups and enable change over time to be monitored.
Daily consumption was measured by asking about drinking in the week preceding the interview, and looked at actual consumption on the heaviest drinking day in that week. Participants aged 16 and over were asked whether they had drunk alcohol in the past seven days. If they had, they were asked on how many days and, if on more than one, whether they had drunk the same amount on each day or more on one day than others. If they had drunk more on one day than others, they were asked how much they drank on that day. If they had drunk the same on several days, they were asked how much they drank on the most recent of those days. If they had drunk on only one day, they were asked how much they had drunk on that day. In each case, the questions asked for details of the amounts consumed of each of the six types of drink (similar to those used for establishing average weekly consumption), rather than asking participants to give a direct estimate of units consumed.
The CAGE questionnaire was asked of participants aged 16 and over, and highlights up to six indicators of problem drinking, including three indicators of physical dependency on alcohol. This questionnaire was administered in self-completion format due to the sensitive nature of the questions.
3.2.2 Unit calculations and new conversion factors
In the UK, a standard unit of alcohol is 10 millilitres or around 8 grams of ethanol. As described above, the majority of advice given in relation to safe alcohol consumption refers to units. The need for accurate estimates of units consumed is therefore paramount. However, there are numerous difficulties associated with calculating units at a population level, not least of which is the variability of alcohol strengths and the fact that these have changed over time.
The strength of an alcohol product is usually expressed as a percentage "alcohol by volume" ( ABV) figure based on the number of units in a litre. A litre of spirits with an ABV of 40% will therefore contain 40 units, while a litre bottle of wine with an ABV of 12% will contain 12 units. However, the ABV of similar types of alcohol products can also vary quite markedly, for example for wine it is typically in the range 11.5%-14.5% ABV. 15 When the original factors for converting the volumes reported by survey participants into units were devised the ABV assumed for wine was 8% meaning that a 750ml bottle of wine of this strength would have contained 6 units. In contrast, a typical bottle of wine nowadays has an ABV of around 12% and contains 9 units (750ml bottle).
To take account of changes in the strength of some alcohol products the Office for National Statistics undertook a review of the existing methodology for converting volumes into units in the General Household Survey and the Health Survey for England (on whose methodology the Scottish Health Survey is based). 16 As noted in the Introduction, the new unit conversion factors based on average strengths of alcohol in 2006 have been applied retrospectively to GHS and SHeS estimates, and were adopted for use in the HSE from 2006 onwards and in SHeS from 2008 onwards.
As described above, information was collected about the volumes of alcohol participants had drunk in a typical week and also on their heaviest drinking day in the week preceding the survey. The following table outlines how the volumes of alcohol reported in the 2003 SHeS were originally converted into units and how the new conversion factors have changed this. The key point to note is that the new conversion factors only apply to the following products/volumes: small cans or bottles of normal strength beer, half pints or small cans / bottles of strong beer, wine and alcopops. The introduction of the separate wine glass sizes in 2008 means that the interim conversion factor used to update the 2003 units (2.0) will have overestimated consumption for people who consumed wine in 125ml sized measures and will have underestimated consumption or those drinking 250ml measures. Preliminary analysis suggests that the most commonly chosen wine glass size was 175ml and that the proportions reporting the 125ml and 250ml roughly balance each other out. At the total population level the introduction of the specific wine glass sizes has therefore had little impact overall. However, it is possible that the change might have made more of an impact on certain groups, for example if consumption of large glasses of wine is more common among some age groups than others. Further analysis of this will be carried out.
Type of drink |
Volume reported |
Original unit conversion factor |
Revised unit conversion factor |
% change |
|---|---|---|---|---|
Normal strength beer, lager, stout, cider, shandy (less than 6% ABV) |
Half pint |
1.0 |
1.0 |
- |
Can or bottle |
Amount in pints multiplied by 2 |
Amount in pints multiplied by 2.5 |
25% |
|
Small can |
1.0 |
1.5 |
50% |
|
Large can/bottle |
2.0 |
2.0 |
- |
|
Strong beer, lager, stout, cider, shandy (6% ABV or more) |
Half pint |
1.5 |
2.0 |
33% |
Can or bottle |
Amount in pints |
Amount in pints |
33% |
|
Small can |
1.5 |
2.0 |
33% |
|
Large can/bottle |
3.0 a |
3.0 |
- |
|
Wine (2003) |
Glass (size unspecified) |
1.0 |
2.0 |
100% |
Wine (2008) |
250ml glass |
Wine glass |
3.0 |
n/a |
175ml glass |
2.0 |
n/a |
||
125ml glass |
1.5 |
n/a |
||
Bottle b |
- |
1.5 |
n/a |
|
Sherry, vermouth and other fortified wines |
Glass |
1.0 |
1.0 |
- |
Spirits |
Glass (single measure) |
1.0 |
1.0 |
- |
Alcopops (2003) |
Small can or bottle |
1.0 |
1.5 |
50% |
Alcopops (2008) |
Small can or bottle |
- |
1.5 |
n/a |
Large (700ml) bottle |
- |
3.5 |
n/a |
Source: adapted from Table 1 in Goddard, 2007 and Table presented in HSE 2006 alcohol chapter 16,20
a The GHS used a conversion factor of 2.3 for large cans/bottles of strong beer whereas SHeS and HSE have always used 3.
b In 2003 wine was not recorded in bottle volumes but interviewers were instructed that a bottle contained 6 units.
3.2.3 Daily drinking threshold changes
The previous section outlined the process of updating the unit conversion factors for the volumes of alcohol participants reported consuming. In addition to this change the thresholds used to define daily unit consumption in excess of recommendations have also changed. Official guidance advises women not to regularly consume more than 2-3 units a day and men not to regularly consume more than 3-4. The figures published in the original report of the 2003 Scottish Health Survey defined daily drinking above these recommended amounts as 3 or more units for women and 4 or more units for men; the 2008 report 17 that presented the revised estimates used the new thresholds set out below. Heavy drinking, used as a proxy for 'binge' drinking, was previously defined as consuming 6 or more units for women and 8 or more units for men (i.e. twice the levels used to report daily drinking). To enable comparability with the Health Survey for England and the General Household Survey these thresholds have now been adjusted, as set out in the table below. The daily drinking estimates in this report are therefore based on both the updated unit factors and these new thresholds.
Measure |
Original definition threshold |
Revised definition threshold |
|---|---|---|
Above 'Safe' daily drinking |
||
Men |
4 or more units |
More than 4 units |
Women |
3 or more units |
More than 3 units |
'Binge' drinking |
||
Men |
8 or more units |
More than 8 units |
Women |
6 or more units |
More than 6 units |
The official guidance in relation to daily drinking is that people should not consume more than the 3 or 4 units recommended for their sex on a regular basis. As the survey did not ask about daily drinking patterns on a regular basis it cannot accurately determine whether these consumption levels exceed the same recommended limits. However, it is probably appropriate to consider someone reporting daily consumption levels greatly in excess of these amounts as being at heightened risk of unsafe or harmful drinking behaviour.
The impact of using the new conversion factors on the various estimates and sub-group analyses was discussed in detail in the report and accompanying web tables that contained the revised 2003 estimates. 17,21 These are not referred to within this report therefore readers with a specific interest in the impact of the new factors should refer to this publication and tables.
It is important to note that in most cases the new ways of estimating the amount of alcohol consumed in Scotland used in this report relate solely to changes to the strength of the alcohol consumed. With the exception of wine and alcopops, no changes have been made to the estimates of the overall volume of alcohol products consumed. As noted above, the impact of the change in wine glass size estimation is thought to have been minimal.
3.3 WEEKLY ALCOHOL CONSUMPTION LEVELS
3.3.1 Usual weekly consumption by age and sex
Table 3.1 shows self-reported weekly alcohol consumption levels for men and women. The average weekly alcohol consumption was higher for men (18.0 units) than women (8.6 units). Women were more likely to be non-drinkers than men (13% versus 10%). For both men and women the proportion of non-drinkers was relatively low up to the age of 64 (11% or less), it increased for those aged 65-74 to 15% for men and 20% for women. In the oldest age category (75 and over) 21% of men and 27% of women were non-drinkers.
Mean weekly consumption levels declined with age. Men aged 16-24 consumed an average of 23.5 units, the figure for those aged between 25 and 64 ranged between 17.8 and 19.4 units, while it then declined to 13.8 units for the 65-74 age group and to 8.3 units among those aged 75 and over. Women's mean weekly consumption followed a similar pattern by age; those aged 16-24 consumed 16.2 units, it then declined and ranged between 7.2 and 9.9 for those aged 25 to 64, and was lower again for those aged 65-74 and 75 and over (5.4 units and 2.7 units respectively). The difference between the consumption levels of men in the oldest two age groups and those in the remaining groups was statistically significant. However, it should be noted that the difference between the mean consumption for men in the youngest age group (16-24) and those in the other age groups up to 55-64 was not significant. In contrast, the difference between the units consumed by women aged 16-24 and the rest of the age groups was significant.
It is recommended that men should not consume more than 21 units of alcohol per week and that women should not consume more than 14 units per week. Men were more likely than women to have exceeded the recommended weekly alcohol consumption levels for their sex; 30% of men drank more than 21 units per week compared with 20% of women who drank more than 14 units per week.
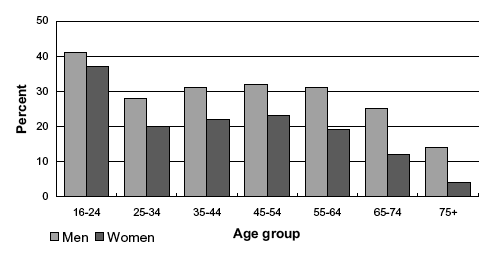
For both men and women, those aged 16-24 were the most likely to have exceeded the recommended weekly amount of alcohol, the proportion then decreased in all other age groups. 41% of men aged 16-24 drank over 21 units per week, decreasing to between 28% and 32% for those aged 25 to 64, and then declining further to 25% of those aged 65-74 and 14% of those aged 75 and over.
A similar pattern was evident for women. 37% of those aged 16-24 drank over 14 units per week. This decreased to between 19% and 23% for those aged 25 to 64, dropping further to 12% of those aged 65-74 and to 4% of those aged 75 and over. As with the mean units, the figures for those aged 16-24 appear very stark in comparison with their older counterparts. However, a similar pattern exists in terms of the overall statistical significance of these results. Among men, only those aged 75 and over had significantly different consumption levels compared with the rest of the age groups. The pattern is different among women, the proportion of those aged 16-24 drinking more than 14 units per week was significantly higher than for the other age groups.
Very high levels of alcohol consumption were relatively rare; 7% of men drank in excess of 50 units and 4% of women drank more than 35 units a week (these are the cut-offs used to classify harmful drinking in the International Classification of Mental Disorders). 22 Heavy drinking decreased with age, from 13% of men aged 16-24 to just 1% of men aged 75 and over. The same was true among women: 11% of those aged 16-24 drank over 35 units per week compared with 1% of those aged over 75. The socio-demographic analysis of weekly drinking, presented below, focuses on mean units per week, the recommended weekly levels as well as these high consumption levels. Table 3.1, Figure 3A
Figure 3A Proportion exceeding government guidelines on weekly alcohol consumption (21 units for men, 14 units for women), by age and sex
3.3.2 Changes in usual weekly consumption since 2003
The trend tables in the original report of the 2003 SHeS data included alcohol data from the 2003, 1998 and 1995 surveys. 23 However, following the considerable recent revisions which have been made to unit calculations (see section 3.2.2 for details), it is no longer sensible to continue comparing alcohol data from the 1998 and 1995 surveys. As such, trend comparisons in alcohol consumption within this report have been restricted to data from the 2003 and 2008 surveys only. It is almost impossible to interpret trends from a table which has only two data points, as the estimate for a particular year may be an outlier at the extreme of the sampling error distribution. Without at least a further data point, it is very difficult to establish whether any increases or decreases observed between 2003 and 2008 reflect an ongoing trend. Therefore it will be useful to draw on comparative data from England for 2008 when that becomes available to see if the patterns here form part of a wider UK trend.
Between 2003 and 2008, the average weekly alcohol consumption for men aged 16 and over declined from 20.3 to 18.0 units. The equivalent figures for women were 9.1 and 8.6 units. The proportion of men drinking more than 21 units also declined, from 34% to 30%, while the proportion of women exceeding 14 units per week declined from 23% to 20%. Although the overall decline in men's average weekly unit consumption was statistically significant it was at the very margin of being so while the decline for women was not significant. The declines in the proportions exceeding recommended weekly limits were marginally insignificant for both men and women.
The decline in both the mean units per week and the proportions exceeding weekly recommendations was apparent for all age groups apart from those aged 16-24. However the increases from 19.6 units to 23.5 units among men aged 16-24, and from 12.2 to 16.2 units among women, were not statistically significant so should not be over-interpreted. The increases in the proportions exceeding weekly limits among this age group were not significant either. This is likely to be due to the small sample size for this age group.
At present the most robust conclusion that can be drawn is that drinking levels remained broadly similar between 2003 and 2008. There is somewhat tentative evidence that consumption declined among men in this period, but more analysis of this is required. For example, it will be advisable to examine these trends further once the 2009 data is available. The sample sizes for some of the age groups (in particular those aged 16-24) are smaller than in previous years so the confidence intervals around the estimates are correspondingly wider. One possibility that might be explored in future is the aggregation of two years' worth of data which might reveal a finer grained picture of drinking patterns. Table 3.2
3.3.3 Usual weekly consumption by socio-demographic factors
Tables 3.3 to 3.5 present the mean units consumed per week, the proportions of men drinking more than 21 and more than 50 units, and the proportions of women drinking more than 14 and more than 35 units by socio-economic classification ( NS-SEC of the household reference person), equivalised household income and the Scottish Index of Multiple Deprivation (descriptions of each of these measures are available in the Glossary at the end of this volume). To ensure that the comparisons presented in this section are not confounded by the different age profiles of the sub-groups, the data have been age-standardised (a description of age-standardisation is available in the Glossary). On the whole the differences between observed and age-standardised percentages are small. Therefore, the percentages presented in the text below are standardised. The tables report both the observed and the age-standardised figures.
Socio-economic classification ( NS-SEC)
Among women, there was a significant relationship between weekly consumption and NS-SEC. Women in managerial and professional households were the most likely to report drinking over 14 units a week (26% had done so). In contrast, 15% of those in lower supervisory and technical households and 17% in semi-routine and routine households consumed more than 14 units a week. There was less variation in the mean units consumed per week which ranged from 7.8 units among women in lower supervisory and technical households to 9.8 units among those in managerial and professional households.
The proportion of men in each NS-SEC group drinking more than 21 units a week ranged between 28% and 34% with no obvious pattern. The same was true of mean units per week. The only evident pattern emerging from these data for men was that those in semi-routine and routine households were twice as likely to drink more than 50 units a week (10%) than those from managerial and professional households (5%). Table 3.3
Equivalised household income
Table 3.4 shows the usual weekly consumption of men and women by equivalised household income quintiles.
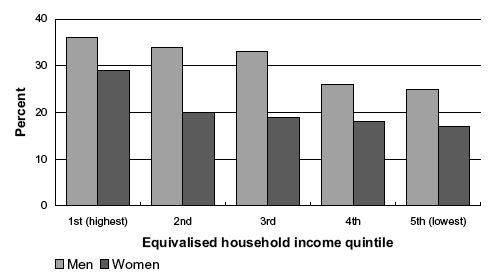
For women there was a clear relationship between equivalised household income and drinking more than the recommended 14 units a week with those in the highest quintile most likely to exceed the weekly limit (29%). The proportion in the remaining four quintiles ranged between 17% and 20%. There was a different pattern for men. A similar proportion of those in the first (highest), second and third income quintiles exceeded 21 units a week (between 33%-36% in each). The proportion was lower for those in the fourth and fifth (lowest) quintiles (26% and 25% respectively).
Women's mean unit consumption was also highest amongst those in the highest income quintile (11.2 units). Men's mean units did not differ significantly between the income groups. Table 3.4, Figure 3B
Figure 3B Proportion exceeding government guidelines on weekly alcohol consumption (age-standardised), by equivalised household income quintile and sex
Scottish Index of Multiple Deprivation ( SIMD)
Two measures of SIMD are being used throughout this report. The first, which uses quintiles, enables comparisons to be drawn between the most and least deprived 20% of areas and the intermediate three quintiles and helps to assess the extent of any inequalities in behaviours or outcomes. The second contrasts the most deprived 15% of areas with the rest of Scotland (described in the tables as the "85% least deprived areas"). The most deprived 15% of areas have been identified as of particular concern by the Scottish Government and are the subject of a number of policy initiatives. The Scottish Health Survey is designed to provide a large enough sample in the SIMD 15% areas after four years to enable robust detailed analysis at this level.
Table 3.5 shows the usual weekly consumption of men and women by SIMD. Women in the least deprived quintile (5 th) were the most likely to drink in excess of 14 units a week (25%), with those in the most deprived (1 st), quintile being least likely to do so (16%). The figures for the three middle groups ranged between 19% and 21%. A similar pattern is evident between those in the 15% most deprived areas and the rest of Scotland, 15% and 21% of whom, respectively, drank more than 14 units a week. The mean units consumed per week did not vary significantly by SIMD.
For men, the proportions drinking over the recommended 21 units a week were very similar across the different deprivation quintiles, and between the 15% most deprived areas and the rest of Scotland. However, men in the most deprived quintile were more likely to drink more than 50 units a week than men in any other quintile (10% did so compared with between 5% to 7% in the other quintiles). 11% of men in the 15% most deprived areas drank more than 50 units a week compared with 7% in the rest of Scotland. Table 3.5
3.4 ESTIMATED DAILY CONSUMPTION
3.4.1 Alcohol consumption on heaviest drinking day in last week by age and sex
Participants were asked how much they had drunk on their heaviest drinking day in the past week; their responses were converted to units of alcohol, as described in Section 3.2. Table 3.6 shows the amounts consumed on the heaviest drinking day in the past week for all adults aged 16 and over. The survey data are not sufficient to determine whether current advice on sensible drinking is being followed (as described in Sections 3.1 and 3.2), since the advice refers to 'regular' drinking patterns rather than this snapshot of consumption on one day. However, it is a useful measure of very heavy consumption levels.
'Binge' drinking, that is drinking an excessive amount on a single occasion, often has more harmful immediate consequences for health and wider society than drinking smaller amounts more regularly (for example consumption that adheres to the recommended daily limits). Although there is no medically-specified criterion to define binge drinking, the GHS and HSE use more than 8 units for men and more than 6 for women as proxies. These levels are reported on in this section, along with the more than 4 units (men)/more than 3 units (women) per day which are used by the same surveys to provide an indicator of the proportions exceeding the daily benchmarks.
The data presented in Tables 3.6-3.10, and discussed in detail below, are based on all adults. Please note that this is a change to the convention used in the previous reports which all examined the daily drinking patterns of only those who drank in the past week. This change brings the data presented here in line with that shown above for weekly drinking and is comparable to the General Household Survey reporting format.
Among men aged 16 and over, 44% drank more than 4 units on their heaviest drinking day in the previous week and 27% drank more than 8 units. Mean consumption was 6.2 units on their heaviest drinking day. (Based only on those who drank in the past week the equivalent figures were 63%, 38% and 8.9 units; data not shown.) Men's daily consumption decreased as age increased. Mean daily consumption levels ranged between 6.7 and 8.6 units between the ages of 16 and 54 and then declined steadily to 1.8 units among men aged 75 and over. The proportions of men drinking over 4 and over 8 units were also higher among the younger age groups. Around a half of men aged under 55 drank more than 4 units on their heaviest drinking day compared with 14% of men aged 75 and over. The pattern was similar for binge drinking; at least 3 in 10 men aged under 55 drank more than 8 units compared with just 2% of men aged 75 and over. These decreases with age were generally accounted for by large increases with age in the proportion of men who drank 2 or fewer units, and for older men in particular, the proportion who drank no units in the past week. For example, 44% of men aged 75 and over drank no units, and a further 32% drank 2 or fewer units, on the heaviest drinking day in the past week.
Women aged 16 and over were less likely than men to have exceeded the daily recommended units for their sex. 36% consumed over 3 units on their heaviest drinking day in the past week, 18% consumed more than 6, and the mean units consumed were 3.5. (The equivalent figures based only on women who drank in the past week were: 63%, 31% and 6.0 units; data not shown.) The pattern by age was similar to that observed for men, although the amounts consumed were noticeably lower overall. Women in the youngest age groups were the most likely to have consumed over 3 units on their heaviest drinking day (ranging from 45% to 54% among those aged between 16 and 44). Notably, women aged 16-24 were the most likely to have consumed over 6 units (41%), they also had the highest mean number of units consumed (7.1) compared with other age groups. All of these rates decreased with age so that by the age of 75 and over only 6% of women drank over 3 units, 1% drank over 6 units and mean daily consumption was just 0.7 units on the heaviest drinking day in the past week. As with men, this decrease with age was largely driven by high proportions of those in the older age groups drinking very little, or not at all, in the past week. 66% of women aged 75 and over did not drink at all and a further 25% drank 2 or fewer units in that period. Table 3.6, Figure 3C, Figure 3D
Figure 3C Proportion of men who drank more than 4 units, and more than 8 units, on the heaviest drinking day in the past week, by age
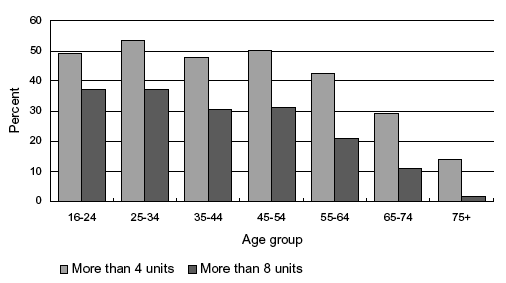
Figure 3D Proportion of women who drank more than 3 units, and more than 6 units, on the heaviest drinking day in the past week, by age
3.4.2 Changes in daily consumption since 2003
As noted above, following the considerable recent revisions which have been made to unit calculations (see section 3.2.2 for details), trend comparisons in alcohol consumption within this report have been restricted to data from the 2003 and 2008 surveys only. Again, it is almost impossible to infer trends from a table which has only two data points, thus whilst the commentary below will highlight differences and similarities in drinking behaviours in 2003 and 2008 these will not necessarily represent any ongoing trends in such behaviour.
Table 3.7 displays the amounts consumed on the heaviest drinking day in the previous week, for adults aged 16 and over in 2003 and 2008. The data show that the proportions of men who drank over 4 units and over 8 units were very similar in both years (45% and 44% drank over 4 units; 29% and 27% drank over 8, respectively). There was also little change in mean consumption which was 6.5 and 6.2 units in 2003 and 2008, respectively. No notable change was evident either within individual age groups, with rates staying generally similar across both time points.
The pattern was much the same for women. Mean daily consumption was 3.6 units in 2003 and 3.5 units in 2008. The proportions drinking over 3 units were 37% in 2003 and 36% in 2008 while 19% drank over 6 units in 2003 and 18% did so in 2008. Table 3.7
3.4.3 Daily alcohol consumption by socio-demographic factors
The same three socio-demographic factors explored in relation to weekly drinking were used to examine daily drinking patterns. Tables 3.8 to 3.10 present the figures for each.
Socio-economic classification ( NS-SEC)
Unlike the pattern found in relation to weekly drinking levels, there was no clear relationship between the proportions exceeding daily recommended limits or binge drinking and NS-SEC among either men or women. Those in semi-routine and routine households were the most likely to have not drunk at all in the past week (39% compared with 25% to 32% in the remaining groups for men, and 51% for women in these households compared with 34% to 43%). In contrast, men in lower supervisory and technical households, and both men and women in semi-routine and routine households, were the least likely to have drunk 2 or fewer units (around 1 in 10 had done so). Table 3.8
Restricting the analysis to only those who had drunk in the past week makes little difference, the proportions exceeding daily recommended limits or binge drinking did not vary significantly between the occupational groups for either sex. Mean units consumed were higher among men in lower supervisory and technical, and semi-routine and routine households than in the remaining groups; the differences between women's mean consumption were not significant.
Equivalised household income
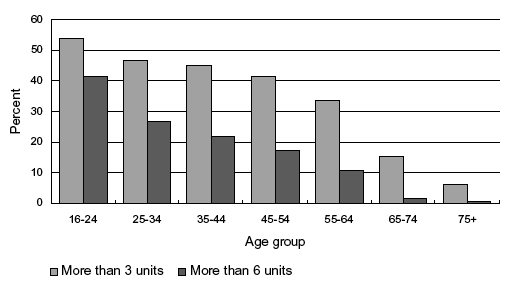
In contrast, and in common with the results for weekly drinking, equivalised household income was significantly associated with mean daily consumption, exceeding recommended daily limits and binge drinking among both sexes. As demonstrated in Figure 3E men's daily consumption generally declined as equivalised household income declined. For example, among men in the highest income quintile, the age-standardised prevalence of consuming over 4 units on the heaviest drinking day in the past week was 52%, it then ranged between 43% and 47% in the next three groups before declining to 35% in the lowest quintile. The pattern for binge drinking was similar but less pronounced; around 3 in 10 in the two highest quintiles drank over 8 units on the heaviest drinking day in the past week, while between 23% and 26% did so in the remaining groups (the lowest figure being found in the lowest quintile). Mean units were also higher among those with higher incomes (6.8 and 6.9 units in the two highest groups compared with 5.5 in the lowest). Nearly half (47%) of men in the lowest income households had drunk no alcohol in the preceding week, the figures for the four highest quintiles ranged between 22% and 32%.
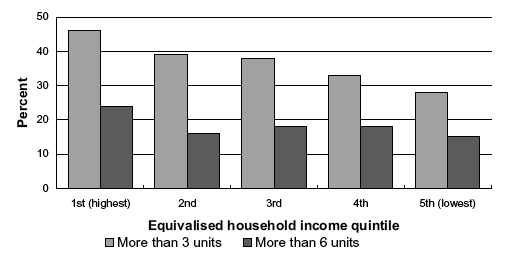
Daily drinking patterns were similar for women, the highest age-standardised prevalence of drinking over 3 units was found among those in the highest income quintile (46%). Prevalence then declined and was similar in the 2 nd and 3 rd quintiles, before further declining in the remaining two lowest quintiles to 33% and 28% respectively. The pattern for binge drinking was different. Although the highest age-standardised prevalence of drinking over 6 units was also found among those in the highest income quintile (24%), the corresponding figures for the rest of the income groups were very similar and ranged between 15% and 18%. The proportion of women who had drunk no alcohol in the preceding week increased as income decreased, from 28% in the highest quintile to 57% in the lowest income quintile. Table 3.9, Figure 3E, Figure 3F
These income differences largely disappear when the people who did not drink at all in the past week are removed from the analysis which confirms that household income is a key determinant of how regularly people drink alcohol. For example, based only on drinkers, the proportions of men exceeding daily recommended levels on the heaviest drinking day in the past week ranged between 62% and 68%, with a slightly lower figure found in the middle quintile (57%). The equivalent figures for women were even more similar in each income quintile (ranging between 58% and 63%). (Data not shown).
Figure 3E Proportion of men who drank more than 4 units, and more than 8 units, on the heaviest drinking day in the past week (age-standardised), by equivalised household income
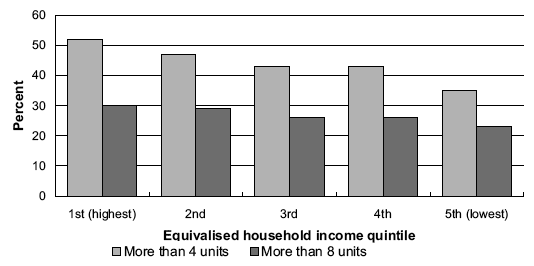
Figure 3F Proportion of women who drank more than 3 units, and more than 6 units, on the heaviest drinking day in the past week (age-standardised), by equivalised household income
Scottish Index of Multiple Deprivation ( SIMD)
Area deprivation was significantly associated with women's daily drinking patterns but for men it was only associated with whether they had drunk at all in the previous week. Women in the most deprived quintile (31%) were the least likely to have consumed more than 3 units on their heaviest drinking day in the past week, the figures for women in the remaining groups ranged between 35% and 42%, with the highest rate being among women in the least deprived quintile. Mean daily units followed a similar pattern of 3.0 units in the most deprived areas compared with between 3.3 and 3.9 in the remaining areas. As found with household income, the likelihood of having drunk alcohol at all in the previous week was associated with area deprivation for both men and women. Men and women in the most deprived areas were the most likely not to have drunk alcohol in the past week (39% of men and 55% of women). In contrast, those in the least deprived quintile were the least likely to have drunk no alcohol (24% of men and 29% of women).
These differences were also apparent when women in the most deprived 15% of areas were compared with the rest of Scotland; 30% and 38% of whom, respectively, drank more than 3 units on the heaviest drinking day in the past week. 39% of men and 57% of women in the most deprived 15% of areas had not drunk alcohol in the preceding week compared with 29% and 40%, respectively, in the rest of Scotland. These patterns are similar to those discussed above in relation to weekly drinking. Table 3.10
There was a different relationship between area deprivation and daily drinking when only drinkers in the past week were considered. Among men who had drunk, mean consumption was higher and binge drinking was more common among those in the most deprived areas. For example, 32% of men in the least deprived quintile who had drunk in the past week consumed more than 8 units on their heaviest drinking day compared with 44% of those in the most deprived quintile. The corresponding mean units were 7.7 and 10.1, respectively. Mean unit consumption was also generally higher among women in more deprived areas, but with a less pronounced pattern. (Data not shown.)
The patterns in relation to the three socio-demographic factors discussed above appear to show that adults from low income households, in areas of high deprivation or from households headed by semi-routine and routine workers drink alcohol less regularly than their more affluent counterparts. However, drinkers from less affluent backgrounds tend to consume higher volumes of alcohol when they do drink.
3.4.4 Factors associated with exceeding the daily limit and binge drinking
Logistic regression was used to examine the factors associated with exceeding the daily limit and also with binge drinking. By simultaneously controlling for a number of factors, the independent effect each factor has on the variable of interest can be established. Logistic regression compares the odds of a reference category (shown in the table with a value of 1) with that of the other categories. The regressions were run separately for men and women, and examined the following independent variables: age group, NS-SEC, equivalised household income quintile, parental NS-SEC when the participant was 14, and SIMD. Age, income and parental NS-SEC were found to be significantly associated with exceeding the daily limit for both men and women.
The odds ratios for exceeding the daily limit on the heaviest drinking day in the past week are presented in Table 3.11. An odds ratio of less than one means that the odds of a given group exceeding the limit for their sex are lower than that of the reference category. The opposite is true when the odds ratio is greater than one. Independent variables with a 'p' value of 0.05 or less are significant predictors of the dependent variable at the 95% confidence level.
The odds of exceeding the daily limit were significantly lower from the age of 35 onwards among men and from 25 onwards among women, relative to those aged 16-24. Those aged 75 and over had the lowest odds (odds ratios of 0.13 for men and 0.06 for women).
The odds of consuming over the daily limit also decreased significantly as income decreased; the odds of those in the lowest quintile drinking over the daily limit were less than half of those in the highest income group (odds ratios of 0.42 for men and 0.44 for women).
Compared with those brought up in managerial and professional households, men who had grown up in households classified as intermediate were more likely to exceed the daily limit (odds ratio of 1.62). In contrast, women brought up in small employer and own account worker households were less likely to (odds ratio of 0.67). Table 3.11
In relation to binge drinking, for men age and parental NS-SEC were significantly associated with binge drinking, but for women only age was significant once all other factors were controlled in the models. (Data not shown.)
3.5 PROBLEM DRINKING AND PHYSICAL DEPENDENCY ON ALCOHOL
3.5.1 Problem drinking by age and sex
Adults who were classified as current drinkers in the main interview (i.e. excluding those who said they never drank nowadays) were asked to complete questions about problem drinking as part of the self-completion questionnaire. These items included six statements about drinking from the CAGE questionnaire, a scale developed for use in clinical settings but suitable for administration in general population surveys. Additional questions were asked about recent experiences of drunkenness. Participants were asked to judge the extent to which each of the six CAGE statements presented in the summary table below had applied to them over the course of the previous three months:
CAGE statement |
% who experienced this in past 3 months |
|
|---|---|---|
Men |
Women |
|
I have felt that I ought to cut down on my drinking |
28 |
21 |
I have felt ashamed or guilty about my drinking |
10 |
7 |
People have annoyed me by criticising my drinking |
9 |
5 |
I have found that my hands were shaking in the morning after drinking the previous night |
6 |
4 |
I have had a drink first thing in the morning to steady my nerves or get rid of a hangover |
5 |
1 |
There have been occasions when I felt that I was unable to stop drinking |
5 |
2 |
The final three statements are indicative of physical dependency. Agreement with two or more of these six CAGE items is a possible indicator of 'problem drinking'.
As shown in the table above, the first statement was most commonly selected (28% of men and 21% of women). Very low proportions selected any of the remaining five statements (ranging from 5 to 10% among men and 1 to 7% among women). The three statements relating to physical dependency were the least likely to be selected by either men or women.
Table 3.12 presents these data by age and sex. Across all statements, the highest proportion of agreement was amongst the youngest two age categories, those aged 16-24 and 25-34. Agreement then declined with age for both men and women. Looking at the first statement about cutting down on drinking, the proportion of men who selected this ranged between 28% and 34% for those aged up to 64, and then decreased to 20% for those aged 65-74 and to 13% for those aged 75 and over. A similar pattern was found for women, although the decline in the proportion selecting it started a little earlier. The proportion ranged between 24% and 26% for the youngest four age groups (16-24 to 45-54) then decreased to 18% for those aged 55-64, 10% for those aged 65-74 and to just 3% for those aged 75 and over.
As noted above, agreement with two or more of the six CAGE items is a possible indicator of 'problem drinking'. Men were more likely than women to have selected two or more of the problem drinking indicators (15% versus 9%), and to have selected one or more of the three physical dependency items (10% versus 5%).
The proportion of men who agreed with two or more problem drinking indicators declined significantly with age from 23% of those aged 16-24 to 6% of those aged 75 and over. The corresponding figures for women were 17% and 2%. This would appear to confirm the patterns discussed above in relation to young women's high weekly and daily consumption patterns. It also suggests that although the sample size for men age 16-24 was too small for their weekly or daily drinking patterns to differ significantly from those in other age groups, the drinking habits of younger people appear to be potentially more harmful than those of their older counterparts. Table 3.12
3.5.2 Trends in problem drinking
Table 3.13 shows the proportion of men and women aged 16 to 74 who agreed with 0, 1 or 2 or more problem indicators in 1998, 2003 and 2008. There has been a four percentage point increase since 1998 in the proportion of men aged 16 to 74 who agreed with two or more of the problem drinking indicators (from 12% in 1998 to 16% in 2008). A similar increase occurred among women (from 5% to 11% over the ten years). The increase over time is most pronounced among those aged 16-24 with the proportion agreeing with two or more of the indicators doubling for men between 2003 and 2008, and for women between 1998 and 2008. However, changes to the overall sample have also seen the sample size for this group reduce considerably in the same period so these figures need to be treated with caution. While there has undoubtedly been an increase over time in problem drinking in the whole population (as measured by the CAGE questionnaire), and young people's drinking would appear to be of particular concern, the magnitude of the increase for younger people might not be of the scale that these data suggest. Aggregating the 2008 and 2009 data for this particular measure to yield larger samples for the different age groups could potentially help here.
The proportion of those not agreeing with any of the problem drinking indicator statements has seen a corresponding decrease over time. 70% of men had no problem drinking in 1998 compared with 63% in 2008. An even greater decline is evident among women, from 85% in 1998 to 71% in 2008. Table 3.13
3.5.3 Drunkenness by age and sex
Adults who were current drinkers were also asked if they had, on average over the last three weeks, been drunk at least once a week. Those who had not were asked if they had been drunk at all within the last 3 months. The results are shown in Table 3.12.
Among current drinkers men were more likely than women to have been drunk in the last 3 weeks (21% of men compared with 13% of women), and to have been drunk at all in the last 3 months (54% and 41% respectively). The prevalence of drunkenness was highest among the youngest age group for men and women and it then decreased within each age category. For example, 43% of men aged 16-24 reported being drunk, on average, at least once a week in the last 3 weeks compared with 17% aged 45-54 and just 3% aged 75 and older. Similarly, 32% of women aged 16-24 said they had been drunk at least once a week in the past three weeks compared with 7% aged 45-54 and 2% aged 75 and older. Table 3.12