Scotland's wellbeing economy monitor: July 2025
The Wellbeing Economy Monitor (WEM) tracks progress towards creation of a wellbeing economy using a broad range of indicators with a particular emphasis where the economy and economic policy play a significant role in contributing to wellbeing outcomes.
6. National wellbeing: natural capital
6.1 Greenhouse gas emissions
Source: UK local authority and regional greenhouse gas emissions statistics; OECD Air and GHG Emissions
Why is it important to a wellbeing economy
A wellbeing economy will contribute to tackling the global climate emergency. Achieving this outcome means ending our contribution to climate change.
What this indicator measures
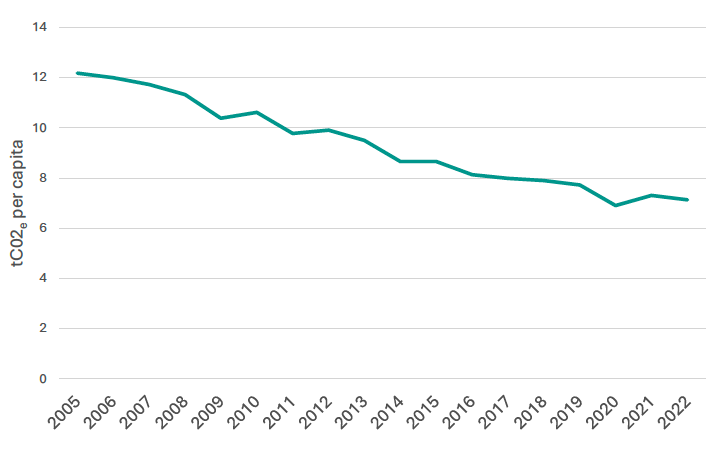
This indicator measures Scotland's greenhouse gas emissions since 2005. It captures the greenhouse gas emissions that are produced within Scotland's territory (or economic sphere), including a share of emissions from international aviation and shipping. The basket of greenhouse gases consists of carbon dioxide, methane, nitrous oxide, and the four F-gases (hydrofluorocarbons, perfluorocarbons, sulphur hexafluoride, and nitrogen trifluoride). Previous versions of the monitor measured the percentage change in emissions since 1990 using the Scottish Greenhouse Gas Statistics. This version uses the UK local authority regional greenhouse gas emissions national statistics, allowing for local authority data to be used alongside national.
Status of indicator
Since 2005, Scotland’s Greenhouse Gas Emissions have fallen steadily from a peak of 12.2 tCO2e in 2005 to 7.1 tCO2e in 2022. Progress has stalled since 2020, with emissions fluctuating around approximately 7 tCO2e.
6.2 Active travel
Source: Transport and Travel in Scotland 2023
Why is it important to a wellbeing economy
Walking and cycling can lead to better physical and mental health, and contribute to decarbonisation of the transport network. This indicator helps measure progress towards the NPF Health outcome “we are healthy and active”.
What this indicator measures
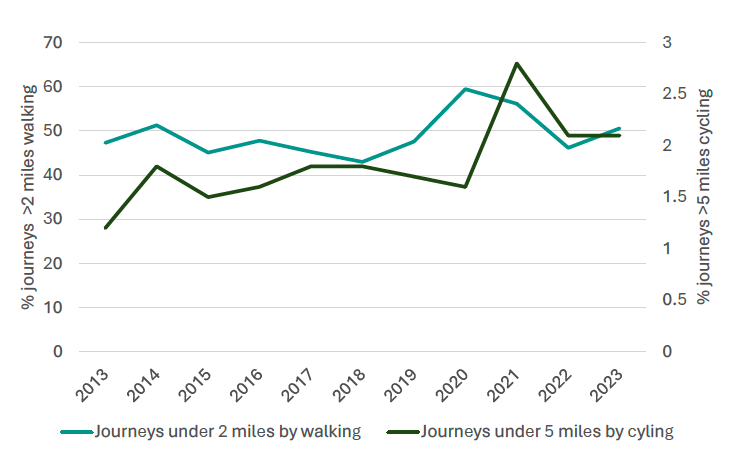
This indicator tells us the proportion of short journeys made by adults (aged 16+) by walking or cycling. A short journey is defined as less than 2 miles for walking or less than five miles for cycling.
Status of indicator
The percentage of journeys under two miles walked was 50.6 per cent in 2023, and the percentage of journeys under five miles cycled was 2.1 per cent. In 2020, due to COVID-19 restrictions the survey was changed from face-to-face to a telephone survey. Response rates were lower and there were some changes to the profile of respondents, including a greater percentage of homeowners and people with graduate qualifications. Therefore, data from 2019 is not considered comparable with 2020-2022. Furthermore, in 2020 interviews were primarily in winter months whereas in 2021 they covered the full year, therefore, there are likely to be seasonal effects on the 2020 figures, but not the 2021 figures. There was also a much smaller sample size in 2020, which makes the usual criteria for change inappropriate.
6.3 Biodiversity
Source: Marine and Terrestrial Species Indicators
Why is it important to a wellbeing economy
Biodiversity is the foundation of life on earth and is crucial for the functioning of ecosystems which provide us with products and services we need to live. Halting and reversing any decline in biodiversity and improving the health and quality of our air, water and soils will help ensure our natural environment is resilient. This indicator will help measure progress towards national biodiversity commitments including the Scottish Biodiversity Strategy[17] and the NPF Environment outcome to “value, enjoy, protect and enhance our environment”.
What this indicator measures
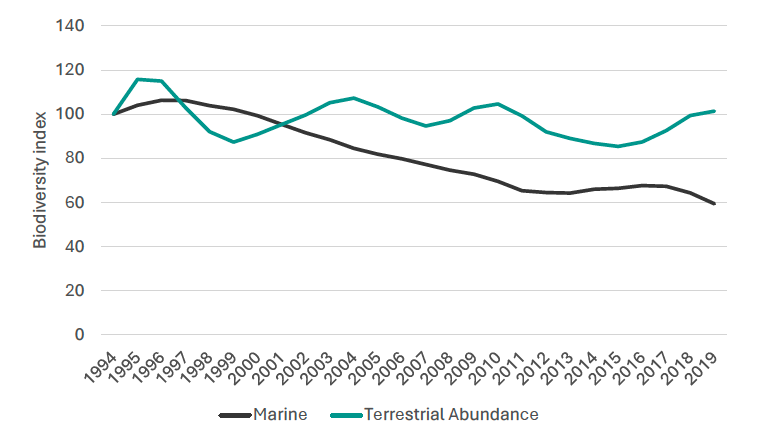
This indicator shows the three metrics that compose Scotland’s biodiversity index. Marine and terrestrial abundance lines reflect changes in the number of a species in these areas, whilst terrestrial occupancy reflects the number of sites where a species is present (therefore the size of the range within which it is found). Quantitative data of changes to Scottish biodiversity prior to 1994 is not captured in this indicator. The marine elements of the indicator continue to be under development as new species data becomes available.
Further information on marine biodiversity status can be found in the Scotland Marine Assessment 2020[18].
Status of indicator
Quantitative data of changes to Scottish biodiversity prior to 1994 is not captured in this indicator. However, the State of Nature Scotland Report 2019 highlighted a sustained decline in biodiversity between 1970 and 1994 and concluded that these trends should be "viewed against a backdrop of profound historic human influences on nature in Scotland".
The marine abundance index fell from 2000 to 2012 before recovering slightly from 2012 to 2018. By 2019 it stood at 59.4 per cent of the 1994 level. The terrestrial abundance index rose between 2000 and 2004, then broadly fell from 2004 to 2015, when it reached 85.4 per cent of the 1994 level.
While the latest value of the terrestrial abundance index stands above the historical average at 101.3 per cent of the 1994 value, this reflects an exceptionally good year for moths, a group with many species in the index[19].
Contact
Email: james.miller@gov.scot