Scotland's wellbeing economy monitor: July 2025
The Wellbeing Economy Monitor (WEM) tracks progress towards creation of a wellbeing economy using a broad range of indicators with a particular emphasis where the economy and economic policy play a significant role in contributing to wellbeing outcomes.
10. Local wellbeing: social capital
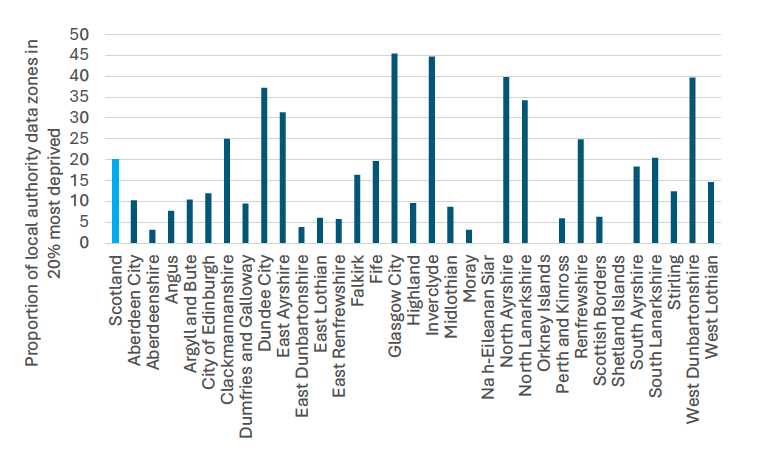
10.1 Deprivation
Source: Scottish Index of Multiple Deprivation
Why is it important to a wellbeing economy
Deprivation limits access to key experiences and material resources and is linked with other negative wellbeing outcomes such as poor mental health. People who live in the most deprived areas are most likely to experience conditions which limit their opportunities in life. The Scottish Index of Multiple Deprivation (SIMD) is a tool for identifying the places in Scotland where people are experiencing disadvantage across various aspects of their lives.
What this indicator measures
This indicator measures the proportion of local authority data zones in Scotland’s 20 per cent most deprived data zones in 2020. The SIMD is a relative measure of deprivation across 6,976 small areas (data zones). If an area is identified as ‘deprived’, this can relate to people having a low income, but it can also mean fewer resources or opportunities. The SIMD looks at the extent to which an area is deprived across seven domains: income, employment, education, health, access to services, crime, and housing.
Status of indicator
There is substantial variation in deprivation across local authorities. The local authority with the highest proportion of deprived areas was Glasgow (45.44 per cent) followed by Inverclyde (44.74 per cent) and North Ayrshire (39.78 per cent). The least deprived local authorities were Shetland Islands and Na h-Eileanan Siar (both with 0 per cent), followed by Aberdeenshire and Moray (both 3.17 per cent).
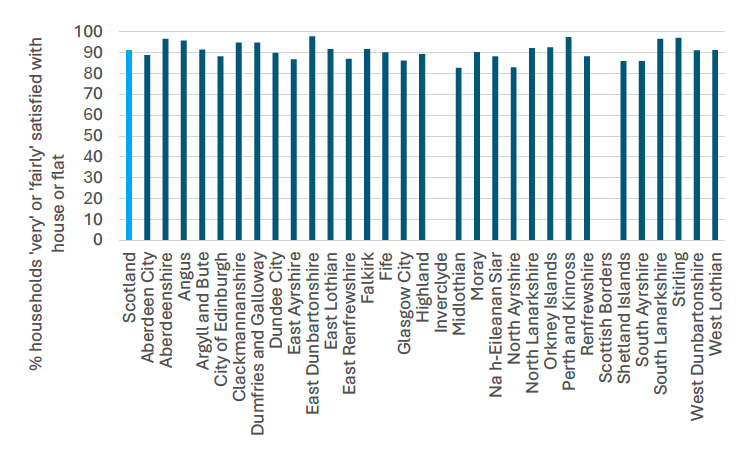
10.2 Housing satisfaction
Source: Scottish Household Survey
Why is it important to a wellbeing economy
Housing is essential to meet basic needs such as shelter. It should provide a place to sleep and rest where people feel safe and have privacy and personal space. The quality of housing people enjoy will depend on both availability and affordability.
What this indicator measures
This indicator measures the percentage of households that reported being “very satisfied” or “fairly satisfied” with their house or flat in 2023. Data for this indicator is from the 2019 Scottish Household Survey. In March 2020, to help prevent the spread of Covid-19, fieldwork for the SHS was suspended. A revised approach was piloted and adopted for the remainder of the 2020 survey sample. The smaller achieved sample size for the SHS 2020 meant local authority breakdowns were not available and only national level data for 2020 was published.
Status of indicator
91 per cent of households across Scotland were “very satisfied” or “fairly satisfied” with their housing in 2023.
Housing satisfaction is fairly consistent across all local authorities, with the least satisfied being Midlothian (82.7 per cent) and the most being Perth and Kinross (97.8 per cent). No data is available for Inverclyde or Scottish Borders.
It should be noted that the results are taken from survey data, with relatively small sample sizes for some local authorities. This leads to relatively large sampling errors for local authority results – that is, the differences between the survey results and the true values if the whole population had been surveyed. This also contributes to variations in year-to-year data
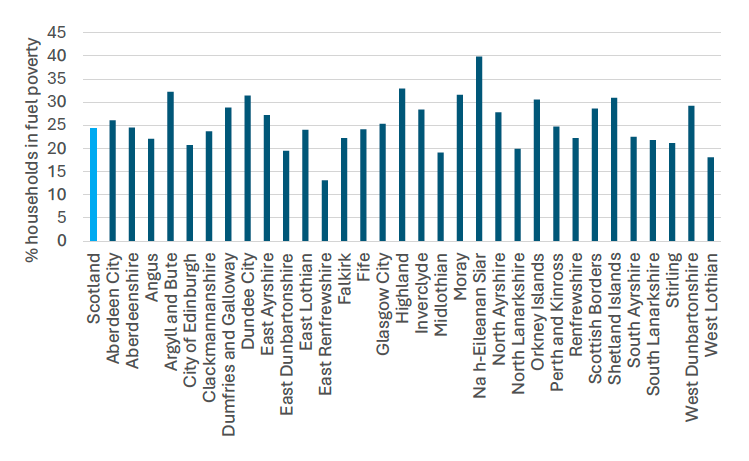
10.3 Fuel poverty
Source: Scottish House Condition Survey
Why is it important to a wellbeing economy
Tackling the four drivers of fuel poverty (poor energy efficiency of the home, low household income, high energy prices, and how energy is used in the home) to ensure everyone can afford the energy they need to live comfortably is essential to achieving this vision.
What this indicator measures
This indicator measures the percentage of households in fuel poverty. Three years of data are combined (e.g. most recent data is for 2017-2019) to mitigate the smaller sample sizes involved when analysing sub-national geographies. Note: as this data is for 2017-19, it pre-dates the cost-of-living crisis. Updated fuel poverty data will be available in 2026. Rising energy prices will have increased the fuel poverty rate and the number of households in fuel poverty.
In July 2019, the Fuel Poverty (Targets, Definition and Strategy) (Scotland) Act[25] received Royal Assent. The Act contains a new definition of fuel poverty which affects how fuel poverty is to be defined and measured. A household is defined as being in fuel poverty if, in order to maintain a satisfactory heating regime, total fuel costs necessary for the home are more than 10% of the household’s adjusted net income (i.e. after housing costs), and if after deducting those fuel costs, benefits received for a care need or disability and childcare costs, the household’s remaining adjusted net income is insufficient to maintain an acceptable standard of living. The remaining adjusted net income must be at least 90% of the UK Minimum Income Standard to be considered an acceptable standard of living with an additional amount added for households in remote rural, remote small town and island areas. If more than 20% of net income is needed, the household is defined as being in extreme fuel poverty.
Status of indicator
Across Scotland, 24.4 per cent of households were in fuel poverty between 2017 to 2019. The highlands and islands tended to report higher rates of fuel poverty, with the top four areas being Na h-Eileanan Siar (39.9 per cent), Highland (32.9 per cent), Argyle and Bute (32.2 per cent), and Moray (31.6 per cent). Conversely, the cities and more urban areas reported some of the lowest rates, such as East Renfrewshire (13.1 per cent), West Lothian (18.1 per cent) and Midlothian (19.1 per cent).
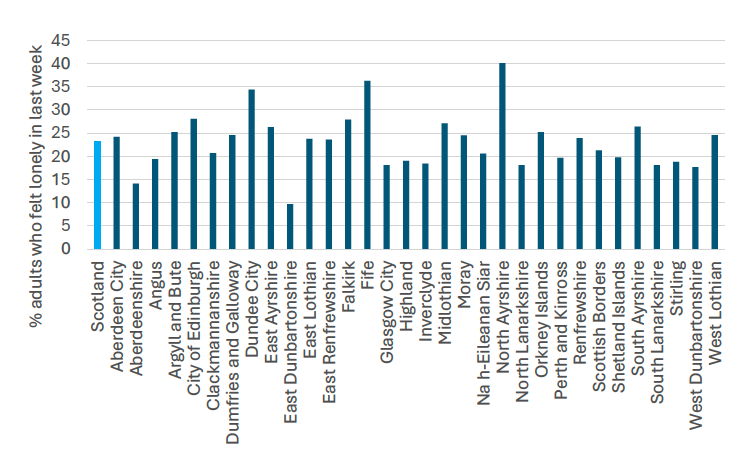
10.4 Loneliness
Source: Scottish Household Survey
Why is it important to a wellbeing economy
A reliable, supportive social network can provide an individual with access to key experiences, services, and other material opportunities.
There are well documented mental health impacts of social isolation and loneliness, including becoming more susceptible to depression, and a greater likelihood of developing clinical dementia for older people who are lonely. There are also significant physical impacts that are comparable to obesity or smoking[26].
What this indicator measures
This indicator measures the percentage of adults who reported feeling lonely “some, most, almost all or all of the time” in the last week in 2022. The national strategy for tackling social isolation and loneliness defines loneliness as ”a subjective feeling experienced when there is a difference between the social relationships we would like to have and those we have.”
Status of indicator
Across Scotland, 23.1 per cent of respondents were lonely “some, most, almost all, or all of the time”. The national picture masks differences between communities and geographies, and large differences in social capital and social connections exist depending on where people live[27]. The local authority with the highest rates of loneliness were North Ayrshire (40.1 per cent). Other local authorities with high rates of loneliness included Dundee (34.4 per cent) and Fife (36.3 per cent). The local authority with the lowest rate of loneliness was East Dunbartonshire (9.7 per cent).
It should be noted that the results are taken from survey data, with relatively small sample sizes for some local authorities. This leads to relatively large sampling errors for local authority results – that is, the differences between the survey results and the true values if the whole population had been surveyed. This also contributes to variations in year-to-year data
10.5 Young people’s participation
Source: Annual Participation Measure
Why is it important to a wellbeing economy
Young people actively participating in productive activities can build their capabilities to increase the nation’s economic resilience and collective wellbeing. This indicator helps measure progress towards the NPF Education outcome to ensure “we are well educated, skilled and able to contribute to society”.
What this indicator measures
This indicator tells us what percentage of a local authority’s 16-19 year olds are participating in education, training, or employment in 2023. Participation status of each individual is calculated by combining the number of days spent in each status between 1st April to 31st March. The overall participation status is based on the classification which has the highest sum of days during the year.
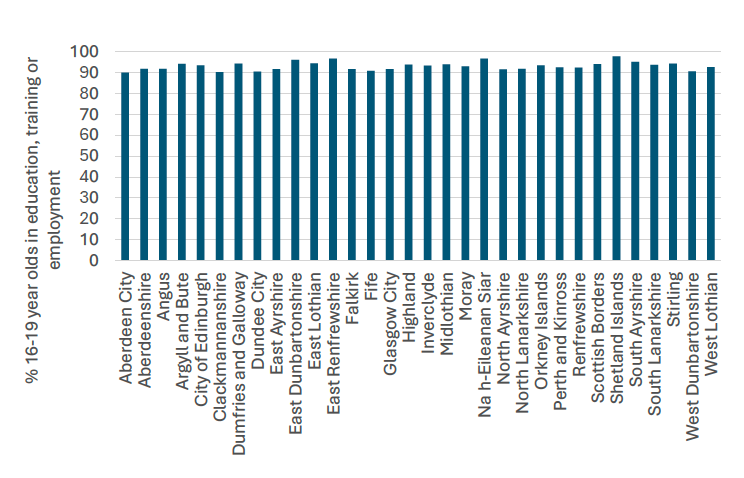
Status of indicator
Young people's participation was relatively consistent across local authorities in 2024, with the lowest being Aberdeen City (90.1 per cent) and the highest being Shetland Islands (97.8 per cent). The rate for Scotland as a whole as 92.7 per cent.
10.6 Gender pay gap
Source: Annual Survey of Hours and Earnings
Why is it important to a wellbeing economy
The existence of a gender pay gap suggests that economic benefits are not being spread fairly because women are facing systemic barriers. This indicator helps measure progress towards national fair work commitments, including the NPF national outcome to “ensure we have thriving and innovative businesses, with quality jobs and fair work for everyone”, the Covid Recovery Strategy[28] outcome “more jobs in the labour market are fair work and green jobs”, the Fair Work Convention[29] outcome to ensure “security of employment, work and income”, and Programme 5 of the NSET[30].
What this indicator measures
This indicator tells us the difference between male and female median hourly earnings (excluding overtime) as a percentage of male hourly earnings in 2024 for full time employees[31]. A positive gender pay gap means men earn more than woman on average.
Contact
Email: james.miller@gov.scot