Scotland's wellbeing economy monitor: July 2025
The Wellbeing Economy Monitor (WEM) tracks progress towards creation of a wellbeing economy using a broad range of indicators with a particular emphasis where the economy and economic policy play a significant role in contributing to wellbeing outcomes.
5. National wellbeing: social capital
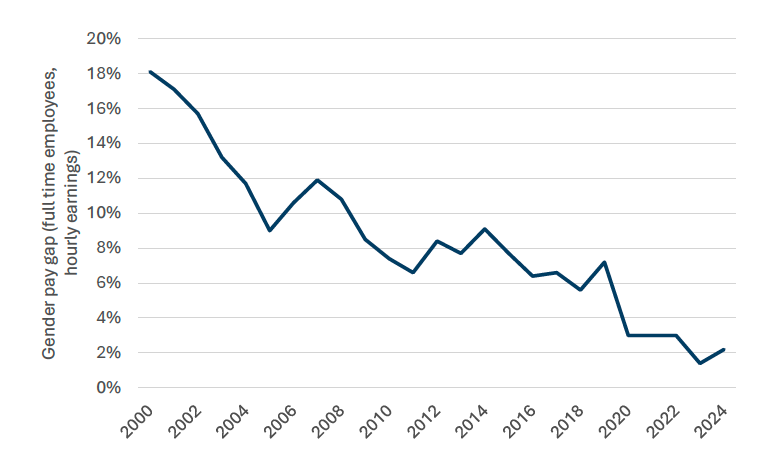
5.1 Gender pay gap
Source: Annual Survey of Hours and Earnings
Why is it important to a wellbeing economy
The existence of a gender pay gap suggests that economic benefits are not being spread fairly because women are facing systemic barriers. This indicator helps measure progress towards national fair work commitments, including the NPF national outcome to “ensure we have thriving and innovative businesses, with quality jobs and fair work for everyone”, the Covid Recovery Strategy[13] outcome to ensure “more jobs in the labour market are fair work and green jobs”, the Fair Work Convention[14] outcome to ensure “security of employment, work and income”, and Programme 5 of the NSET[15].
What this indicator measures
This indicator tells us the difference between male and female hourly median earnings (excluding overtime) as a percentage of male earnings across all jobs. It reflects the earnings of full time employees[16]. A positive gender pay gap means men earn more than woman on average.
Status of indicator
The gender pay gap for full time employees median hourly earnings has increased from 1.4 per cent per cent in 2023 to 2.2 per cent in 2024, a rise of 0.8 percentage points.
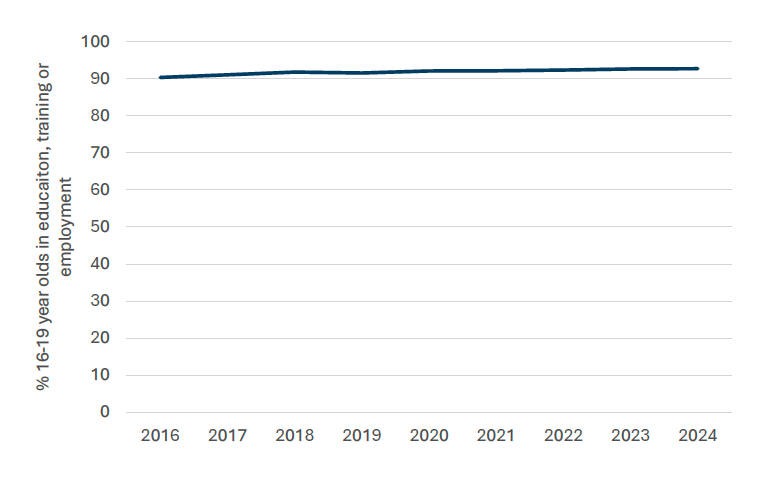
5.2 Young people’s participation
Source: Annual Participation Measure
Why is it important to a wellbeing economy
Young people actively participating in productive activities can build their capabilities to increase the nations economic resilience and collective wellbeing. This indicator helps measure progress towards the NPF Education outcome to ensure “we are well educated, skilled and able to contribute to society”.
What this indicator measures
This indicator tells us what percentage of the nations 16-19 year olds are participating in education, training, or employment. Participation status of each individual is calculated by combining the number of days spent in each status between 1st April to 31st March. The overall participation status is based on the classification which has the highest sum of days during the year.
Status of indicator
The participation rate has remained broadly unchanged over the past 7 years. In 2024, the rate was 92.7 per cent, up 0.1 percentage points from 2023, when the participation rate was 92.6 per cent.
Contact
Email: james.miller@gov.scot