Scotland's wellbeing economy monitor: July 2025
The Wellbeing Economy Monitor (WEM) tracks progress towards creation of a wellbeing economy using a broad range of indicators with a particular emphasis where the economy and economic policy play a significant role in contributing to wellbeing outcomes.
4. National Wellbeing: produced/financial capital
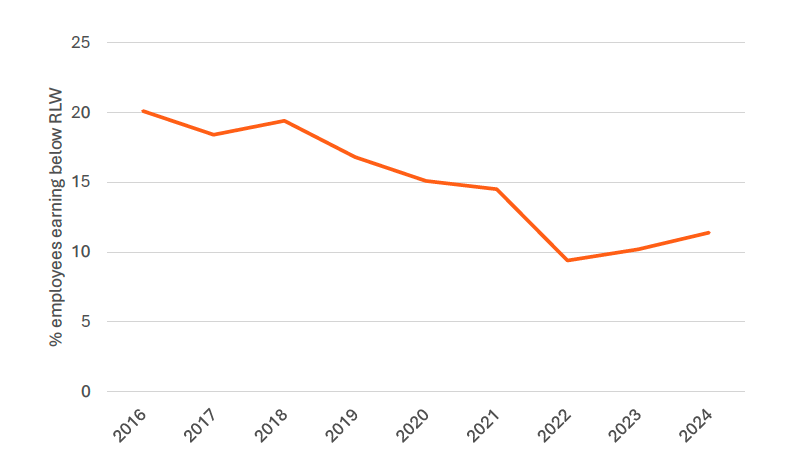
4.1 Employees earning below real living wage
Source: Annual Survey of Hours and Earnings 2024
Why is it important to a wellbeing economy
Evidence has suggested not earning the real living wage is linked with negative wellbeing outcomes such as being unable to afford necessities or spend time with family[9]. This indicator helps measure progress towards Fair Work commitments, including the NPF fair work and business outcome to ensure we have ‘thriving and innovative businesses, with quality jobs and fair work for everyone’.
What this indicator measures
The proportion of employees aged 18 or over who are earning less than the real living wage. Real living wage rates are calculated annually by the Resolution Foundation based on evidence about UK living standards[10].
Status of indicator
The proportion of employees in Scotland aged 18 and over earning less than the real living wage was 11.4 per cent, up 1.2 percentage points from 10.2 per cent in 2023.
4.2 Income inequality
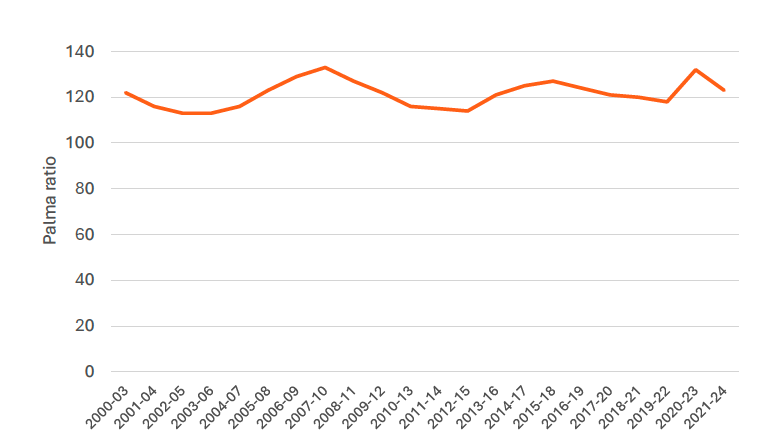
Source: Poverty and Income Inequality in Scotland
Why is it important to a wellbeing economy
Large income differences can have damaging health and social consequences[11]. Narrowing income inequality can improve a population’s health and wellbeing[12]. This indicator helps measure progress towards the NPF Economy outcome to “have a globally competitive, entrepreneurial, inclusive and sustainable economy”.
What this indicator measures
This indicator measures income inequality in Scotland by the Palma ratio: the total income of the top ten per cent of the population divided by the total income of the bottom forty per cent of the population. Therefore this indicator tells us how much more income top-income households have compared to those at the bottom. The indicator estimates income from all sources, including earnings, benefits, tax credits, pensions, and investments, after deductions for income tax, national insurance contributions, council tax, pension contributions and maintenance payments. The indicator does not include deductions for housing costs, such as mortgage payments or rent. Household income has been equivalised to adjust for the fact that larger families require larger, but less than proportionally larger, incomes to achieve similar standards of living.
Status of indicator
Income inequality in Scotland has fluctuated over the period shown above. In recent years, it had been decreasing from a peak of 127 per cent in 2015-18 to 118 per cent in 2019-22. This decrease ended in 2020-23, when income inequality reached a high of 134 per cent. In the latest data point for 2021-24, the top ten per cent of the population had 23 per cent more income (before housing costs) than the bottom forty per cent combined.
4.3 Wealth inequality
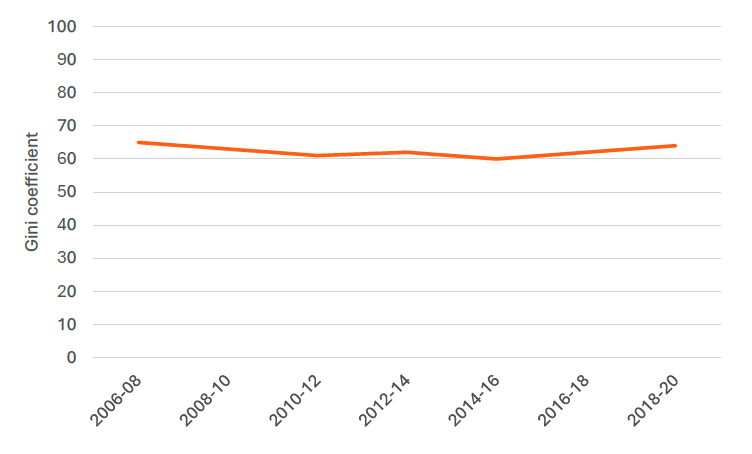
Source: Wealth in Scotland 2006-2020
Why is it important to a wellbeing economy
Wealth is a key component of wellbeing as wealth is used to improve current or future living standards, to invest in opportunities such as education or entrepreneurial activities, or to provide a buffer for emergencies such as unemployment or illness. This indicator helps measure progress towards our NPF Poverty outcome to “tackle poverty by sharing opportunities, wealth and power more equally”.
What this indicator measures
This indicator tells us how wealth is distributed within Scotland. It refers to the personal wealth of households, including financial, physical, property and pension wealth of all household members. Business assets are not included. This indicator uses the Gini coefficient, which is a statistical measure of dispersion often used to assess economic inequality. The Gini coefficient ranges from 0 per cent to 100 per cent. 0 per cent means all households have the same wealth, 100 per cent means one household has all the wealth and the other households have none. The Gini coefficient is widely used, however it is not perfect. It can be overly sensitive to changes in the middle and not sensitive enough to changes at the top and bottom of the distribution.
Status of indicator
In 2018-20, the Gini coefficient of total wealth was 64 per cent. It has been broadly stable since 2006-08, when data collection began, ranging between 60 per cent and 65 per cent.
4.4 Gross fixed capital formation
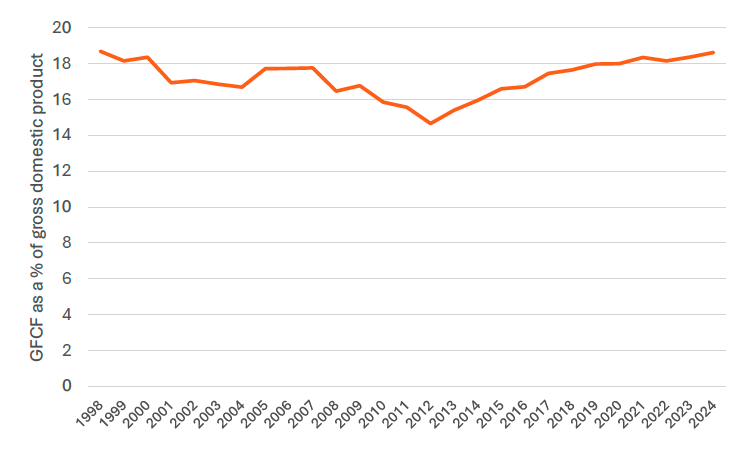
Source: Quarterly National Accounts
Why is it important to a wellbeing economy
Investment in capital increases capacity to deliver goods and services which in turn can improve people’s quality of life.
What this indicator measures
This indicator tells us the value of net capital expenditure by public and private sector (“gross fixed capital formation”, or GFCF) as a per cent of national gross domestic product (GDP).
This includes spending on housing, other buildings and structures, transport, intellectual property, ICT and cultivated assets. It does not include spending on stockpiles and works in progress, as these are not fixed capital assets. By considering GFCF as a per cent of GDP, it gives an indication of the balance in the economy between consumption and investment.
Status of indicator
Since 2012, Scotland’s GFCF trended upwards from approximately 16% in 2014 to just over 18% in 2018. Scotland’s GFCF has remained relatively steady since 2020, at 18.63 per cent in 2024 (compared to 18.37 per cent in 2023, 18.15 per cent in 2022 and 18.34 per cent in 2021).
4.5 Community asset ownership
Source: Community Ownership in Scotland
Why is it important to a wellbeing economy
Community ownership of assets allows citizens to take on a degree of responsibility for their communities, and can ensure that valued local resources are nurtured, protected, and used to the benefit of those in the local area. This indicator helps us measure progress towards the NPF Communities outcome, “we live in communities that are inclusive, empowered, resilient and safe”.
What this indicator measures
This indicator tells us the number of assets that community groups own. Assets include areas of land, buildings, or anything else of substantial value. A community group is locally led, has sufficient level of community support, is open to all within that community, is non-profit and it’s main purpose is the furthering of sustainable development in the local area. There is no centralised database of community assets – this data is sourced from a variety of organisations involved in community asset ownership, including those involved in providing community groups with funding to purchase assets. This data is quality assured by the Scottish Government and is then sent to the Registers of Scotland who verify it against the Land Register. Only assets where the transfer of ownership has been completed are included in the published statistics.
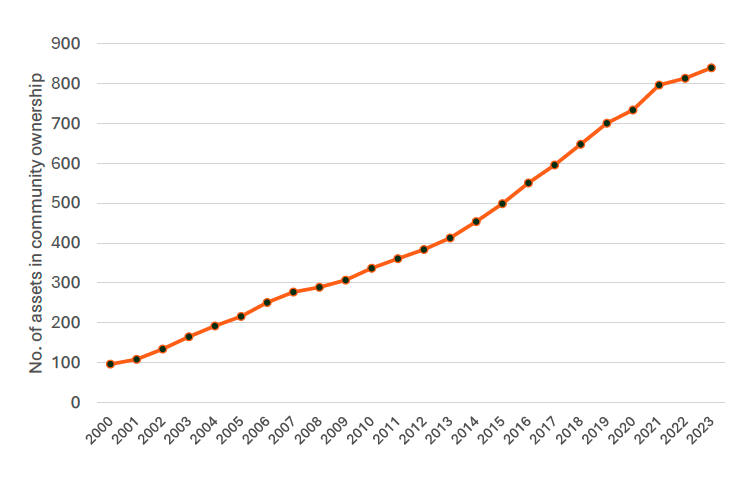
Status of indicator
The number of assets in community ownership has been increasing year on year since 2000. In 2023, there were 840 assets in community ownership, an increase of 3.2 per cent over the last year and 19.8 per cent over the last five years. Prevalence of community asset ownership varies strongly between local authorities, with higher rates observed in more rural areas. Over a third of all community assets are held in Highland (204) and Argyll and Bute (102). Just over 3 per cent of community assets are in Edinburgh and Glasgow.
Contact
Email: james.miller@gov.scot