Publication - Statistics
Scottish Transport Statistics No 29: 2010 Edition
Has figures on (e.g.) road vehicles, traffic, accidents, bus and rail passengers, road and rail freight, air and water transport, finance, personal travel and international comparisons.
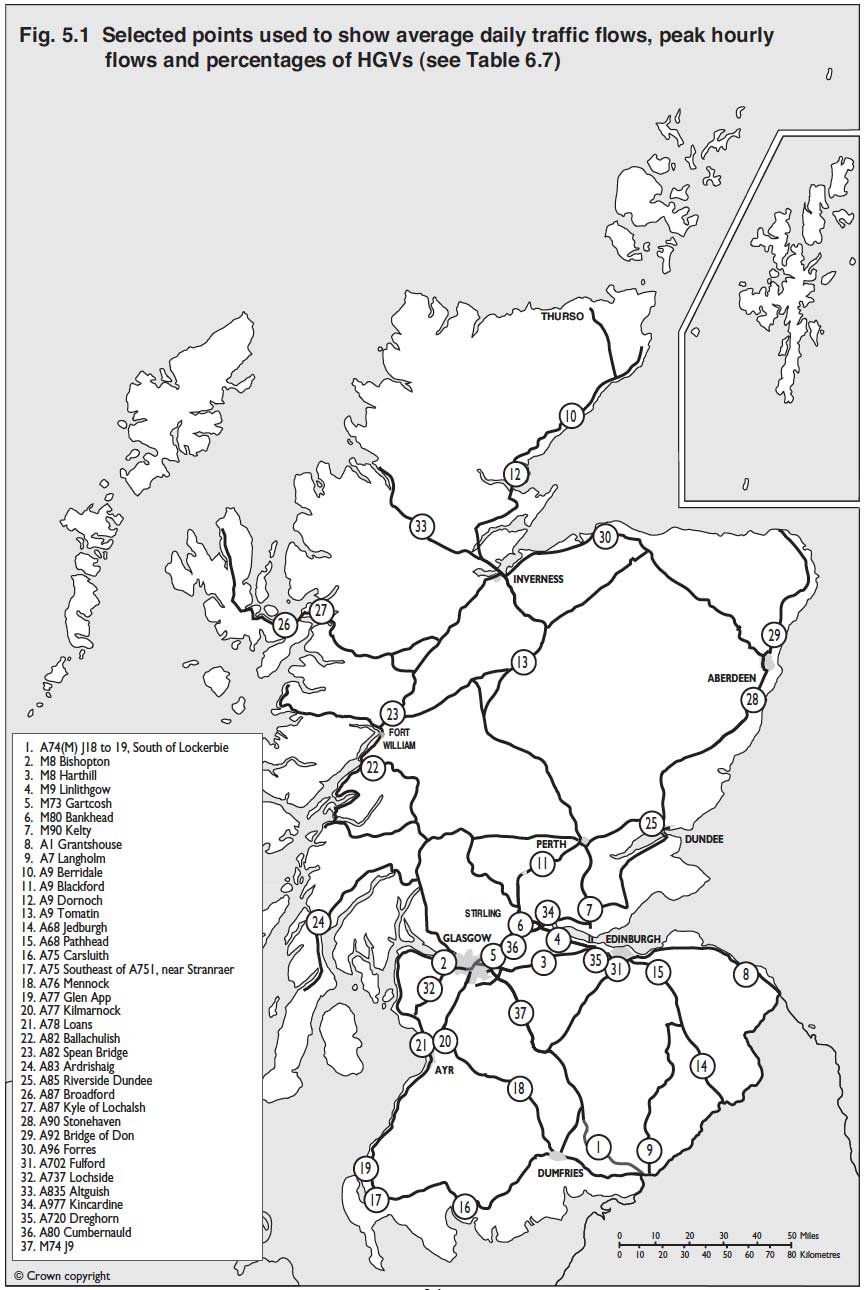
Figure 5.1 Selected points to show average daily traffic flows, peak hourly flows and percentages of HGVs