Scottish Transport Statistics No 29: 2010 Edition
Has figures on (e.g.) road vehicles, traffic, accidents, bus and rail passengers, road and rail freight, air and water transport, finance, personal travel and international comparisons.
CHAPTER 2 BUS AND COACH TRAVEL
Figure 2.1 Vehicle stock by type of vehicle
Thousand
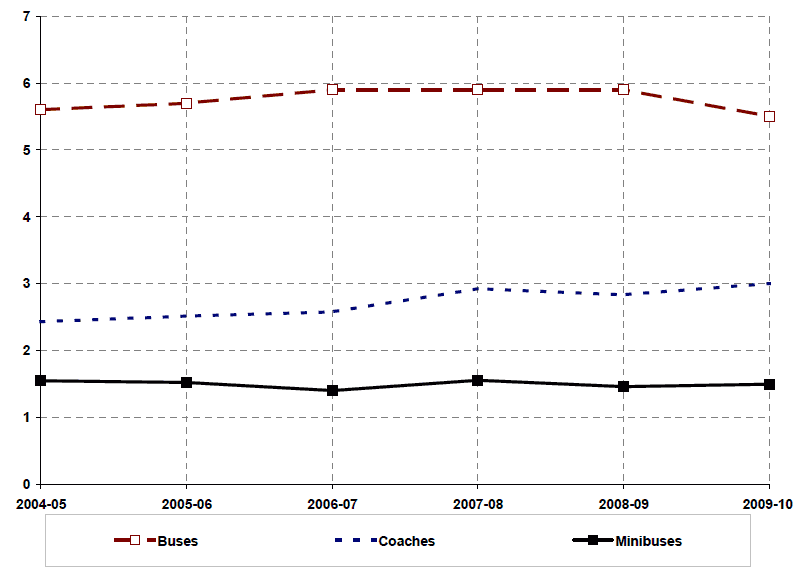
Note: Comparable data prior to 2004/05 is not available due to changes in methodology
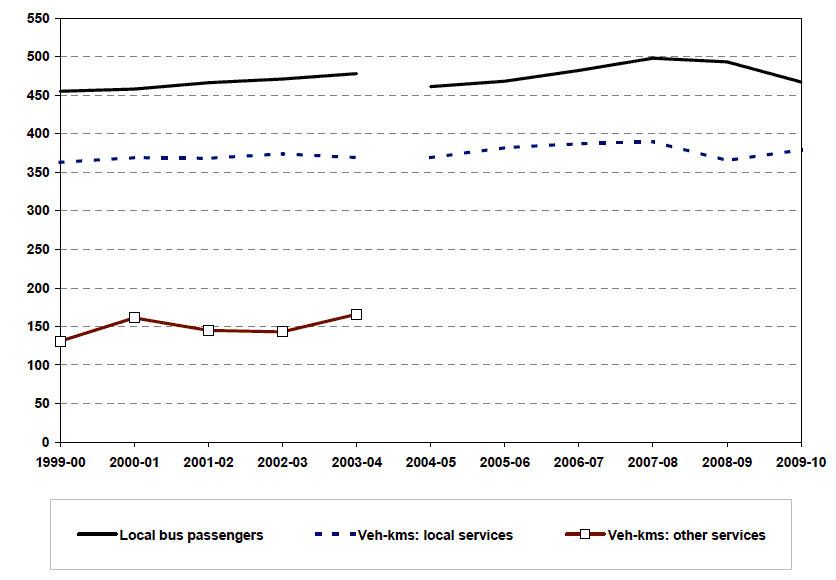
Figure 2.2 Passenger journeys (boardings) and vehicle-kilometres
Millions
1. Introduction
1.1 This chapter provides information on bus and coach travel, such as the numbers of passenger journeys and vehicle-kilometres, passenger receipts and local bus fare indices, the numbers of vehicles of various types and the numbers of staff employed.
1.2 Estimates of passenger numbers, receipts and fares are based on a survey by the DfT and are therefore subject to sampling error. Figures from 2004-05 onwards are based on a improved methodology and may not be directly comparable with previous years. See Section 4.1.
2. Main Points
Vehicles & Passengers
2.1 While the number of buses has fallen slightly from 5,600 to 5,500 since 2004-05, the number of coaches has increased from 2,400 to 3,000. ( Table 2.1)
2.2 In 2009-10 there were 467 million passenger journeys (boardings) on local bus services, 5.3% less than the previous year and 1% more than 2004-05. Passenger numbers rose annually from 2004-05 to 2007-08 before dipping in the last 2 years. ( Table 2.2)
2.3 The distance travelled by local bus services in 2009-10 (379 million vehicle kms) was 3.8% higher than the previous year and 2.7% more than in 2004-05. ( Table 2.3)
2.4 There were a total of 18,200 staff employed by bus and coach operators in 2009-10, 3% less than the previous year and 2% more than 2004-05. ( Table 2.4)
Receipts & fares
2.5 Bus passenger revenue from local services in 2009-10, amounted to £626 million. This was £15 million less than 2008-09 and in real terms (constant prices) a decrease of £24 million (4%) and 7% higher than 2004-05. ( Table 2.5)
2.6 DfT survey data show falls in the real term price of local bus fares in 2010 (compared with March of the previous year) of 2.1% for Scotland and 0.1% in Great Britain. These follow large real term increases in 2009 (10.7% in Scotland and 8.2% in the whole of GB) due to a fall in general 2009 price levels and sharp current price fare increases of 10.3% (Scotland) and 7.8% ( GB). ( Table 2.6)
Scottish Household Survey
2.7 The 2009 Scottish Household Survey shows 84% of households are within 6 minutes walk of a bus stop. About 5% said that they had no bus service or were at least 14 minutes walk away from the nearest bus stop. However, about 26% of householders in remote rural areas, and around 20% of those in accessible rural areas, said that they had no bus service or were at least 14 minutes walk away from one. ( Table 2.7)
2.8 In 2009, at least 71% were satisfied with bus services offered, their cleanliness and comfort, ability to find out about tickets and routes and the ease of changing to other forms of transport. There were noticeable differences in those who felt safe on the bus during the day and in the evening (day: 91%, evening: 58%). 'Fares are good value' had the lowest agreement rate for buses with 57% of respondents doing so. ( Table 2.8)
3. Notes and Definitions
3.1 Local bus service: one which is available to the general public, where passengers pay separate fares and travel a radial distance no greater than 15 miles (24 kms) from the point of boarding.
3.2 Other services: include contract, private hire, express journeys, excursions and tours which are not registered as local services.
3.3 Passenger journeys (boardings): the statistics are compiled on the basis that each boarding of a vehicle counts as one passenger journey. Therefore, each trip made by a passenger on one vehicle on one route counts as a separate journey. Return tickets therefore count as two passenger journeys. The numbers of passenger journeys using season tickets or travel passes are largely based on button presses by the driver and DfT now include adjustments in the published estimates to allow for driver under-counting (see paragraph 4.1.5 below).
3.4 Vehicle kilometres: estimates include some categories of empty running of buses (e.g. between garage and terminus) but exclude driver instruction and vehicle testing.
3.5 Local bus fare indices: Information about the size of each fares change is supplied by a panel of large operators. Indices are obtained by averaging the reported changes using weights based on receipts from passengers (excluding concessionary fare reimbursement from local authorities). In theory, therefore, the index measures the change in the average charge to the fare-paying passenger. The implementation of free concessionary fares is, though, included once, in the quarter within which it was introduced.
3.6 Commercial services: are those run without direct financial support from a local transport authority. They are still eligible for central Government subsidy in the form of the Bus Service Operators Grant ( BSOG) (formerly known as the fuel duty rebate) and (where applicable) for concessionary fare reimbursement from local transport authorities.
3.7 Subsidised services: are those considered socially necessary and run under contract to local transport authorities with some direct subsidy. They include a few services subsidised without competitive tendering, under Section 91 of the Transport Act 1985 ('de minimis' arrangements).
3.8 Concessionary fare reimbursement: A National Concessionary Travel schemes for groups such as elderly people and disabled people was rolled out in early 2006. Prior to that local authorities ran their own schemes. Bus perators are reimbursed for revenue lost as a result of their participation in the schemes, after taking into account a portion of the income from the extra travel generated, i.e. it is supposed to be profit-neutral. Journeys made under these schemes can be found in Table 11.29. These schemes should not be confused with the reductions offered to children, for example, by many operators on commercial grounds.
3.9 Staff employed: Platform staff comprise drivers, conductors and any other on-vehicle staff; maintenance staff include all employees engaged on cleaning, repair, service or maintenance of vehicles, while other staff include administrative staff. There may be some duplication of functions, particularly amongst the smaller operators.
3.10 Walking time to nearest bus stop: the Scottish Household Survey ( SHS) interviewer asks how long it would take him/her to walk to the nearest bus stop (or place where one could get a bus).
3.11 Frequency of bus service: the SHS interviewer asks about the frequency of service at the nearest bus stop (or place one could get on a bus). If the householder says that the frequency of service varies, the interviewer asks for the week-day off-peak frequency.
3.12 SHS urban/rural classification: notes on this appear in Chapter 12.
4. Sources
4.1 The DfT survey of Public Service Vehicle Operators
4.1.1 The basis for most of the statistics in this chapter is the annual returns which a sample of Public Service Vehicle operators makes to the Department for Transport (DfT).
4.1.2 The sample includes all operators who are licensed with 21 or more licence discs (which normally, but not always, equate to the number of vehicles), plus a random sample of smaller operators. Because there is more interest in locally-registered service operators, local operators are over-sampled; they are identified list of operators who receive BSOG and other sources. Sampling for both local and other operators is stratified and based upon the size of the operator's fleet (in terms of the number of licence discs) and geographical location identified by the first two letters of the postcode for the operator's address.
4.1.3 Proxy data are generated for all local operators, but for which data are missing either because they were not sampled or because they did not respond. These will be based either on previous returns from the operator or using other methods such as using other data the operator has supplied. The figures for the non-local smaller operators are grossed-up using a grossing-up factor which is the inverse of the achieved sampling fraction for each size-group and each type of area (conurbation, large urban, etc.).
4.1.4 The figures for Scotland are primarily based on returns for operators with an address in Scotland, even though some operators may do work in England and vice versa. However, important information relating to local operators (mainly passenger boardings, vehicle kilometres and passenger receipts) are obtained at local authority level and so these estimates will exclude data relating to England, even though other variables such as staff numbers are all allocated to just one of its local authorities - the one with the highest number of passenger boardings. ( NB: a large group, such as Stagecoach, is not treated as a single operator: there will be a separate statistical return for each of its subsidiary companies.)
4.1.5 In September 2006, DfT revised the passenger numbers for each year from 1985/86 onwards in order to adjust for driver under-recording of the numbers of passengers who did not pay cash (e.g. those using season tickets, concessionary fare passes, return halves of tickets etc). A further survey showed that the allowance was not affected by the introduction of free concessionary fares.
4.1.6 In October 2010, the DfT revised passenger numbers, vehicle kms and passenger revenue relating to 2004/05 onwards. Although previous figures are presented these are not strictly comparable with the later years.
4. Further Information
4.1 The Scottish Government statistical bulletin Bus and Coach Statistics contains further information on Scottish bus and coach services, including more detailed comparisons with Great Britain and more detailed analyses of the Scottish Household Survey's questions on bus-related topics. More details of this publication are given under Scottish Government Transport Statistics Publications which also indicates how it can be found on the Scottish Government Website.
4.2 DfT's Focus on Public Transport volume and its Public Transport Statistics Bulletin include some more detailed analyses of GB bus and coach statistics.
4.3 Enquiries regarding the statistics in Tables 2.1 to 2.6 should be made to Paul Gaught, Department for Transport, Tel: 0207 944 3076 bus.statistics@dft.gsi.gov.uk
4.4 Further info on the Scottish Household Survey figures can be found in Chapter 12. Enquires on the SHS- based Tables 2.7 and 2.8 should be made to Andrew Knight of the Scottish Government Transport Statistics branch (tel: 0131 244 7256).