Scottish Transport Statistics No 29: 2010 Edition
Has figures on (e.g.) road vehicles, traffic, accidents, bus and rail passengers, road and rail freight, air and water transport, finance, personal travel and international comparisons.
Figure 1.1 New registrations by taxation group
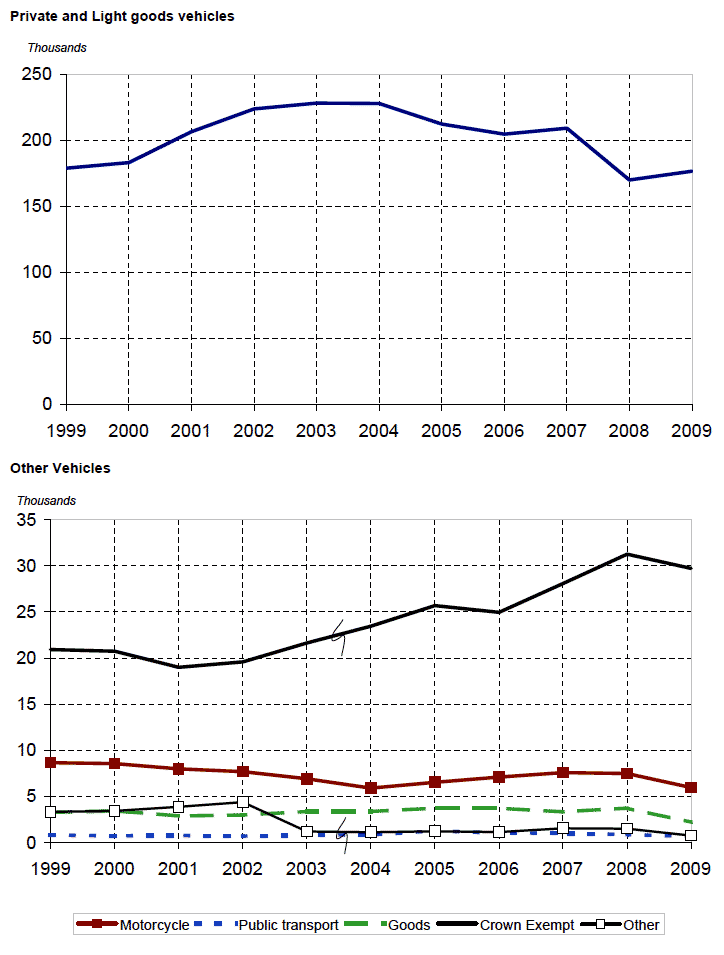
Note: In 2003 the definition of "Crown Exempt" and "Other" categories mean figures aren't strictly comparable.
See footnote 3 of table 1.1
Table 1.1 New registrations by taxation group, body type and method of propulsion
1999 |
2000 |
2001 |
2002 |
2003 |
2004 |
2005 |
2006 |
2007 |
2008 |
2009 |
|
|---|---|---|---|---|---|---|---|---|---|---|---|
thousand |
|||||||||||
by type of vehicle (taxation group) |
|||||||||||
Private and light goods |
179.0 |
183.3 |
206.6 |
224.0 |
228.4 |
228.0 |
212.5 |
204.9 |
209.3 |
170.1 |
176.7 |
Motorcycles |
8.7 |
8.6 |
8.0 |
7.7 |
6.9 |
5.9 |
6.6 |
7.1 |
7.6 |
7.5 |
6.0 |
Public transport 1 |
0.8 |
0.8 |
0.8 |
0.7 |
0.8 |
0.9 |
1.3 |
1.1 |
1.0 |
0.9 |
0.7 |
Goods |
3.3 |
3.5 |
2.9 |
3.0 |
3.4 |
3.4 |
3.7 |
3.7 |
3.3 |
3.7 |
2.2 |
Crown and exempt 2 |
20.9 |
20.8 |
19.0 |
19.6 | |
21.6 |
23.5 |
25.7 |
25.0 |
28.1 |
31.3 |
29.7 |
Other vehicles 2 |
3.3 |
3.4 |
3.9 |
4.4 | |
1.2 |
1.1 |
1.2 |
1.2 |
1.6 |
1.5 |
0.8 |
Total |
216.1 |
220.3 |
241.2 |
259.4 |
262.4 |
262.8 |
251.0 |
242.9 |
250.9 |
215.0 |
216.1 |
by body type |
|||||||||||
Cars |
181.9 |
187.2 |
205.5 |
220.1 |
219.0 |
217.5 |
202.9 |
196.2 |
202.2 |
172.4 |
185.9 |
Taxis |
0.4 |
0.5 |
0.5 |
0.4 |
0.4 |
0.4 |
0.5 |
0.6 |
0.6 |
0.3 |
0.2 |
Motorcycles |
8.9 |
8.2 |
8.1 |
7.8 |
7.1 |
6.0 |
6.6 |
7.2 |
7.8 |
7.7 |
6.1 |
Three wheelers |
0.1 |
0.0 |
0.0 |
0.0 |
0.0 |
0.0 |
0.0 |
0.0 |
0.0 |
0.0 |
0.0 |
Light goods 3 |
14.6 |
14.5 | |
18.3 |
21.4 |
25.2 |
28.2 |
29.6 |
28.2 |
28.9 |
22.9 |
14.4 |
Goods 3 |
4.0 |
4.6 | |
3.1 |
3.1 |
2.9 |
2.7 |
3.0 |
3.0 |
3.8 |
4.2 |
3.0 |
Buses and coaches |
1.3 |
1.2 |
1.2 |
1.3 |
1.5 |
1.2 |
1.6 |
1.5 |
1.3 |
1.2 |
0.8 |
Agricultural vehicles etc |
2.6 |
2.4 |
2.8 |
3.3 |
3.3 |
3.4 |
2.9 |
2.9 |
3.3 |
3.5 |
3.1 |
Other vehicles |
2.4 |
1.8 |
2.3 |
2.0 |
3.1 |
3.2 |
3.8 |
3.3 |
3.0 |
2.9 |
2.5 |
All vehicles |
216.1 |
220.3 |
241.2 |
259.4 |
262.4 |
262.8 |
251.0 |
242.9 |
250.9 |
215.0 |
216.1 |
by method of propulsion |
|||||||||||
Petrol |
166.3 |
168.7 |
176.6 |
177.7 |
167.6 |
157.5 |
142.0 |
137.3 |
143.2 |
117.2 |
123.8 |
Diesel |
49.5 |
51.3 |
64.4 |
81.4 |
94.5 |
104.9 |
108.6 |
105.2 |
106.7 |
96.6 |
91.0 |
Electric |
0.0 |
0.0 |
0.0 |
0.0 |
0.0 |
0.0 |
0.0 |
0.0 |
0.4 |
0.5 |
0.6 |
Gas or petrol/gas |
0.3 |
0.3 |
0.1 |
0.0 |
0.0 |
0.0 |
0.0 |
0.0 |
0.0 |
0.0 |
0.0 |
Gas Bi-Fuel |
.. |
.. |
0.1 |
0.2 |
0.2 |
0.2 |
0.1 |
0.0 |
0.0 |
0.0 |
0.0 |
Others 4 |
.. |
0.0 |
0.0 |
0.0 |
0.0 |
0.1 |
0.2 |
0.4 |
0.7 |
0.7 |
0.8 |
Total |
216.1 |
220.3 |
241.2 |
259.4 |
262.4 |
262.8 |
251.0 |
242.9 |
250.9 |
215.0 |
216.1 |
1. Estimates include only those vehicles with more than 8 seats.
2. Vehicles in the Special Concessionary Group (part of other vehicles in 2002 and earlier years) are part of Crown and Exempt from 2003 onwards
3. DfT has revised the figures for the light goods and goods body types back to 2001. DfT does not have the underlying data to revise earlier years' figures.
4. Hybrid Electricity, Gas Diesel and Steam.