Scottish Transport Statistics No 29: 2010 Edition
Has figures on (e.g.) road vehicles, traffic, accidents, bus and rail passengers, road and rail freight, air and water transport, finance, personal travel and international comparisons.
Table 9.1 Waterborne freight lifted, discharged and moved, by type of traffic
(a) Waterborne freight lifted in Scotland, and moved, by type of traffic
1999 |
2000 |
2001 |
2002 |
2003 |
2004 |
2005 |
2006 |
2007 |
2008 |
2009 |
|
|---|---|---|---|---|---|---|---|---|---|---|---|
Freight lifted ( weight ) |
million tonnes |
||||||||||
Coastwise traffic 1 |
|||||||||||
Liquid bulks |
27.80 | |
17.66 |
13.54 |
12.29 |
12.34 |
13.68 |
16.95 |
12.54 |
15.07 |
15.79 |
13.59 |
Coal |
1.30 |
1.17 |
1.50 |
1.14 |
1.26 |
1.06 |
2.15 |
1.59 |
1.28 |
1.40 |
1.02 |
Other |
6.20 |
5.85 |
5.59 |
5.77 |
5.91 |
5.75 |
6.44 |
6.45 |
6.43 |
6.09 |
5.23 |
Total |
35.30 | |
24.68 |
20.63 |
19.20 |
19.50 |
20.49 |
25.53 |
20.58 |
22.79 |
23.28 |
19.83 |
One Port traffic 2 |
|||||||||||
To rigs |
2.58 |
1.54 |
1.90 |
1.81 |
1.54 |
1.34 |
1.76 |
1.48 |
1.83 |
1.75 |
3.59 |
Sea dumped |
- |
- |
- |
- |
- |
- |
- |
- |
- |
- |
- |
Total |
2.58 |
1.54 |
1.90 |
1.81 |
1.54 |
1.34 |
1.76 |
1.48 |
1.83 |
1.75 |
3.59 |
Inland waterway traffic |
|||||||||||
Internal |
- |
- |
- |
0.01 |
- |
- |
- |
- |
- |
- |
- |
Coastwise |
4.56 |
5.63 |
4.62 |
3.96 |
4.05 |
3.92 |
4.77 |
4.19 |
4.10 |
3.99 |
3.43 |
One Port |
- |
0.03 |
- |
0.03 |
0.02 |
0.02 |
0.02 |
0.11 |
0.03 |
0.02 |
0.04 |
Foreign |
4.91 |
6.58 |
6.79 |
6.01 |
5.99 |
6.03 |
5.41 |
5.86 |
6.36 |
8.18 |
6.63 |
Total |
9.47 |
12.24 |
11.41 |
10.01 |
10.06 |
9.97 |
10.19 |
10.16 |
10.50 |
12.19 |
10.10 |
All above traffic 3 |
42.79 |
32.80 |
29.32 |
27.03 |
27.03 |
27.86 |
32.70 |
27.92 |
30.98 |
33.21 |
30.06 |
Port exports 4 |
67.22 | |
73.19 |
67.00 |
67.78 |
58.90 |
54.45 |
45.00 |
43.99 |
45.58 |
42.42 |
38.32 |
All freight lifted 5 |
105.10 | |
99.41 |
89.53 |
88.80 |
79.94 |
76.28 |
72.29 |
66.06 |
70.20 |
67.44 |
61.75 |
Freight moved ( weight x distance ) |
million tonne-kilometres |
||||||||||
Coastwise traffic 1 |
|||||||||||
Liquid bulks |
23,020 | |
15,750 |
11,450 |
10,340 |
10,460 |
10,580 |
13,523 |
10,550 |
13,155 |
14,456 |
12,360 |
Coal |
510 |
160 |
410 |
180 |
360 |
170 |
391 |
368 |
305 |
343 |
261 |
Other |
3,320 |
4,220 |
3,690 |
4,020 |
4,030 |
3,310 |
3,543 |
3,573 |
3,449 |
3,090 |
2,700 |
Total |
26,850 | |
20,100 |
15,600 |
14,540 |
14,850 |
14,060 |
17,457 |
14,491 |
16,909 |
17,890 |
15,321 |
One Port traffic 2 |
|||||||||||
To rigs |
600 |
1,540 |
1,900 |
1,810 |
1,540 |
1,270 |
1,762 |
1,482 |
1,832 |
1,746 |
2,287 |
Sea dumped |
- |
- |
- |
- |
- |
- |
- |
- |
- |
- |
- |
Total |
600 |
1,540 |
1,900 |
1,810 |
1,540 |
1,270 |
1,762 |
1,482 |
1,832 |
1,746 |
2,287 |
Inland waterway traffic |
|||||||||||
Internal |
- |
- |
- |
- |
- |
- |
- |
- |
- |
- |
- |
Coastwise |
100 |
120 |
110 |
100 |
90 |
90 |
115 |
101 |
101 |
101 |
83 |
One Port |
- |
- |
- |
- |
- |
- |
- |
- |
- |
- |
- |
Foreign |
140 |
160 |
170 |
150 |
140 |
140 |
135 |
146 |
166 |
210 |
160 |
Total |
240 |
280 |
280 |
240 |
240 |
240 |
251 |
249 |
268 |
312 |
244 |
All above traffic 6 |
27,690 |
21,920 |
17,780 |
16,590 |
16,630 |
15,570 |
19,470 |
16,222 |
19,009 |
19,948 |
17,852 |
Port exports 7 |
.. |
.. |
.. |
.. |
.. |
.. |
.. |
.. |
.. |
.. |
.. |
All freight 7 |
.. |
.. |
.. |
.. |
.. |
.. |
.. |
.. |
.. |
.. |
.. |
1. Covers all coastwise cargo lifted in Scotland, regardless of its destination.
2. Covers cargoes lifted in Scotland for offshore installations and for dumping at sea.
3. Total of Coastwise traffic, One Port traffic and the Internal and Foreign components of Inland Waterway traffic. Excludes Coastwise and One Port components of Inland Waterway traffic to avoid double counting.
4. Major ports only. There were seven major ports in 1996; eight in 1997 and 1998; nine in 1999;and 11 from 2000 onwards.
5. Coastwise traffic, One Port traffic, the Internal component of Inland Waterway traffic, and Port exports. Excludes Coastwise and One Port components of Inland Waterway traffic to avoid double counting.
6. This is the total of Coastwise traffic, One Port traffic and Inland Waterway traffic. No double counting exists asthe Coastwise component of Inland Waterway traffic relates to the distance travelled on inland waterways, and Coastwise traffic relates to the distance travelled at sea.
7. Figures for tonne-kilometres are not available for exports (and, in any case, would not be relevant to Scottish transport statistics).
Figure 9.1 Foreign and domestic freight traffic by port
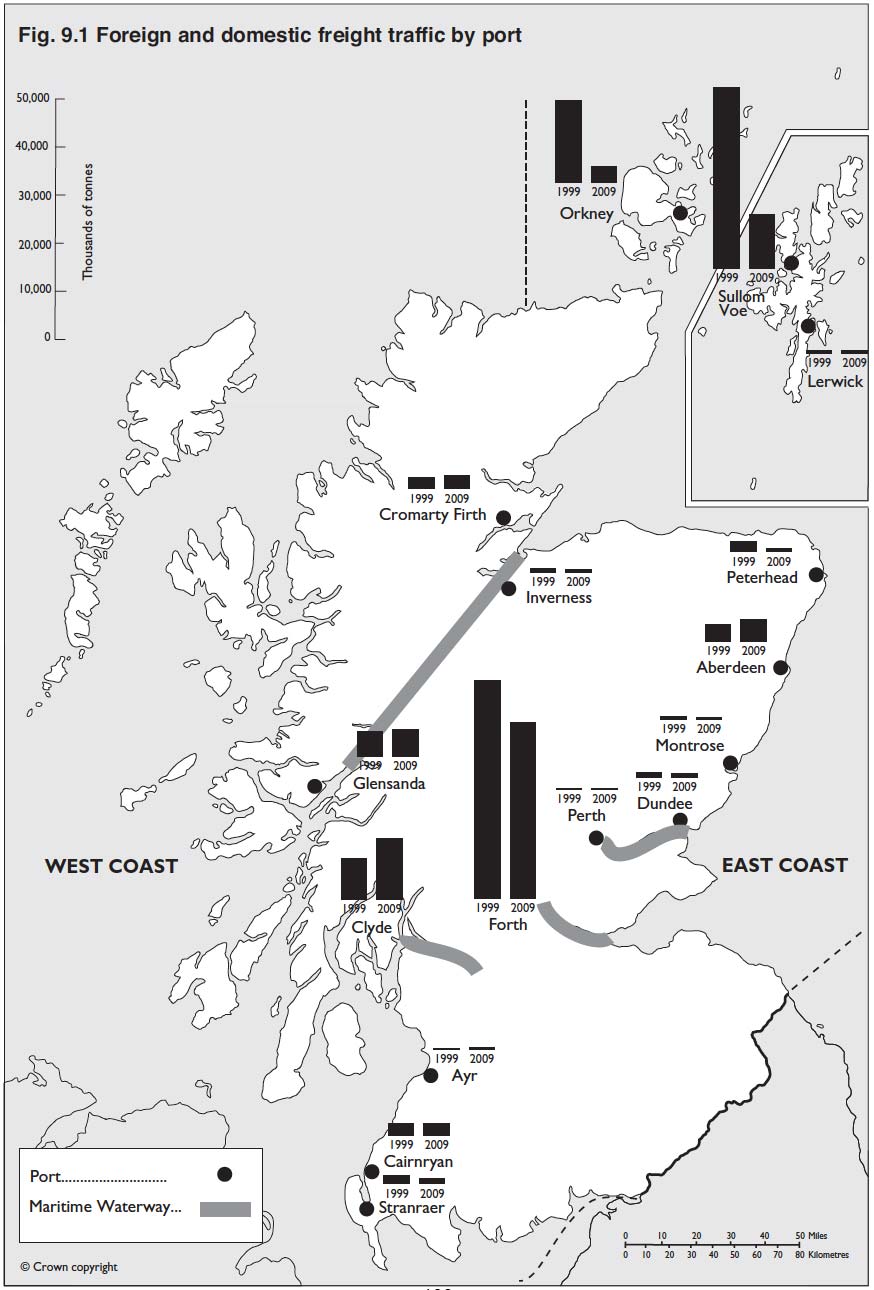
Table 9.1 (continued) Waterborne freight lifted, discharged and moved, by type of traffic
(b) Waterborne freight discharged in Scotland, and moved, by type of traffic
Note: there is no information on inland waterway traffic discharged in Scotland
1999 |
2000 |
2001 |
2002 |
2003 |
2004 |
2005 |
2006 |
2007 |
2008 |
2009 |
|
|---|---|---|---|---|---|---|---|---|---|---|---|
Freight discharged ( weight ) |
million tonnes |
||||||||||
Coastwise traffic 1 |
|||||||||||
Liquid bulks |
4.20 | |
3.44 |
4.08 |
3.48 |
3.19 |
3.56 |
4.29 |
3.56 |
3.62 |
2.79 |
2.52 |
Coal |
- |
- |
- |
- |
- |
- |
- |
0.01 |
0.04 |
0.02 |
- |
Other |
4.10 |
3.46 |
3.75 |
3.49 |
3.62 |
3.34 |
4.17 |
4.22 |
4.13 |
4.20 |
3.77 |
Total |
8.30 | |
6.90 |
7.83 |
6.98 |
6.83 |
6.90 |
8.46 |
7.79 |
7.79 |
7.01 |
6.29 |
One Port traffic 2 |
|||||||||||
From rigs |
3.51 | |
11.73 |
7.48 |
13.35 |
12.74 |
10.24 |
9.57 |
8.31 |
7.86 |
4.06 |
2.75 |
Sea dredged |
- |
- |
- |
0.02 |
0.02 |
0.02 |
0.02 |
0.02 |
0.02 |
0.02 |
0.01 |
Total |
3.51 | |
11.73 |
7.48 |
13.37 |
12.75 |
10.26 |
9.58 |
8.33 |
7.87 |
4.07 |
2.76 |
Inland waterway traffic 3 |
.. |
.. |
.. |
.. |
.. |
.. |
.. |
.. |
.. |
.. |
.. |
Port imports 4 |
6.62 | |
10.82 |
17.47 |
11.43 |
9.50 |
15.00 |
17.02 |
17.91 |
14.61 |
16.11 |
13.53 |
Freight moved ( weight x distance ) |
million tonne-kilometres |
||||||||||
Coastwise traffic 1 |
|||||||||||
Liquid bulks |
1,580 | |
1,660 |
2,130 |
1,770 |
1,610 |
2,060 |
2,120 |
1,811 |
1,907 |
1,444 |
1,445 |
Coal |
10 |
- |
- |
- |
- |
- |
- |
- |
39 |
12 |
- |
Other |
960 |
770 |
940 |
850 |
900 |
630 |
960 |
1048 |
943 |
1031 |
953 |
Total |
2,600 | |
2,430 |
3,070 |
2,610 |
2,520 |
2,690 |
3,090 |
2,862 |
2,890 |
2,487 |
2,399 |
One Port traffic 2 |
|||||||||||
From rigs |
3,510 |
11,750 |
7,490 |
13,380 |
12,780 |
10,270 |
9,580 |
8,325 |
7,870 |
4,067 |
2,762 |
Sea dredged |
- |
- |
- |
- |
- |
- |
- |
- |
- |
- |
|
Total |
3,510 | |
11,750 |
7,490 |
13,380 |
12,780 |
10,270 |
9,580 |
8,325 |
7,870 |
4,067 |
2,762 |
Inland waterway traffic 3 |
.. |
.. |
.. |
.. |
.. |
.. |
.. |
.. |
.. |
.. |
.. |
Port imports 5 |
.. |
.. |
.. |
.. |
.. |
.. |
.. |
.. |
.. |
.. |
.. |
1. Covers all coastwise cargo discharged in Scotland, whether it was loaded in Scotland or elsewhere in the UK.
2. One port traffic covers cargoes from offshore installations and sea dredged aggregates unloaded in Scotland.
3. Information about Inland Waterway traffic discharged in Scotland is not available from the statistics compiled by DfT.
4. These figures relate to major ports only (please see the notes on the Sources of the statistics). There were seven major ports in 1996; eight in 1997 and 1998; nine in 1999; and eleven in 2000 onwards
5. Figures for tonne-kilometres are not available for imports (and, in any case, would not be relevant to Scottish transport statistics).