Publication - Statistics
Scottish Transport Statistics No 29: 2010 Edition
Has figures on (e.g.) road vehicles, traffic, accidents, bus and rail passengers, road and rail freight, air and water transport, finance, personal travel and international comparisons.
Table 11.17 Employed 1 adults (16+) - place of work: 2009
Works from home |
Does not work from home |
All employed adults |
Sample size (=100%) |
|
|---|---|---|---|---|
row percentages |
||||
All employed adults |
11.4 |
88.6 |
100 |
6,103 |
Self-employed |
56.6 |
43.4 |
100 |
745 |
Employed full-time |
5.6 |
94.4 |
100 |
4,049 |
Employed part-time |
5.2 |
94.8 |
100 |
1,309 |
1. Those whose current situation was described as self-employed, employed full-time or employed part-time.
Figure 11.3: Travel to work a) 1999 and b) 2009
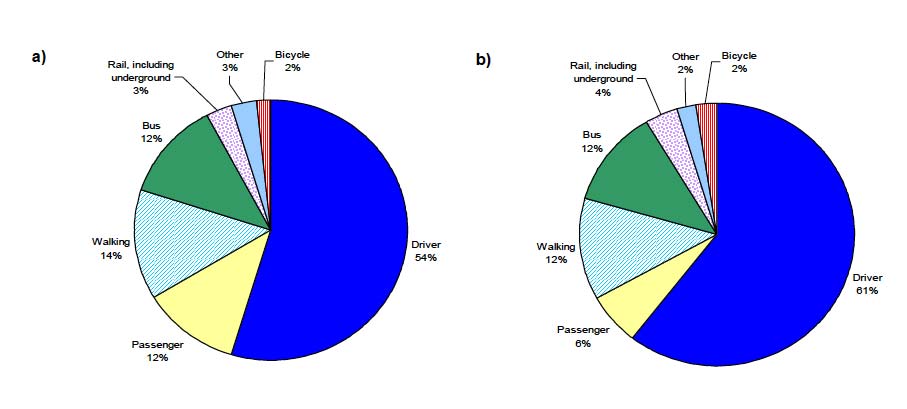
Figure 11.4: Experience of congestion, 2003 - 2009