Economic Report on Scottish Agriculture 2011 Edition
Invalid description field:Agriculture
Part of
Chart C1: Agricultural Area for each UK country, June 2010
Land use
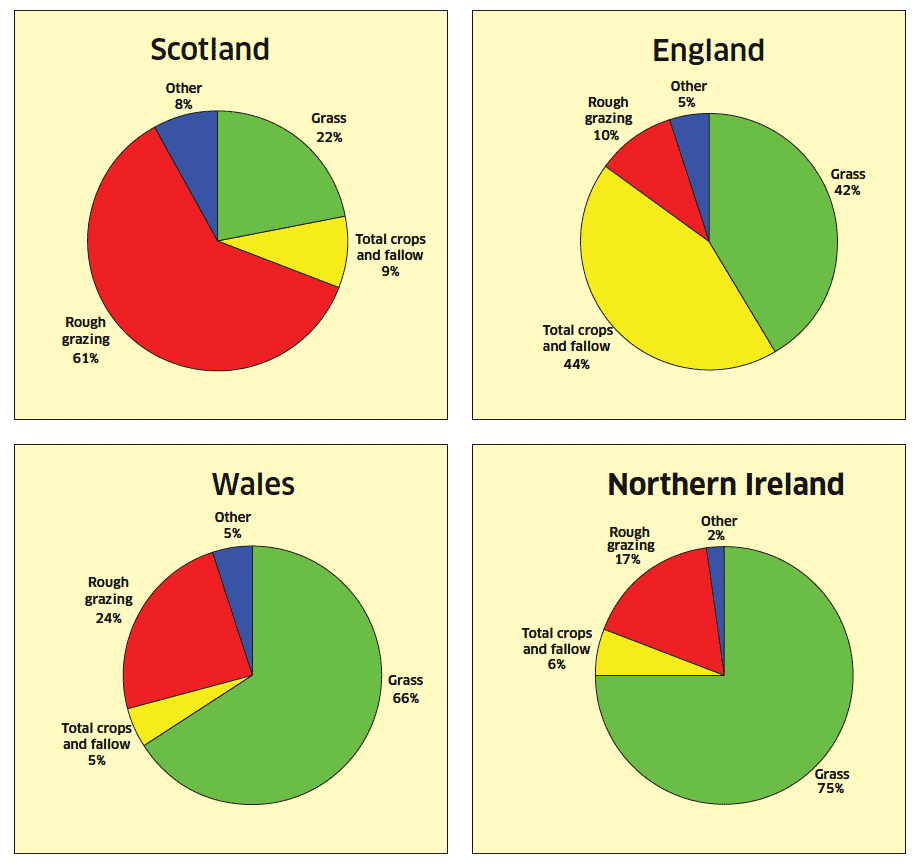
Land use comparisons with the UK ( Table C2 and Chart C1)
The total agricultural area in Scotland including common grazing totalled 6.23 million hectares in 2010, representing 80% of the total land area in Scotland. This proportion of total land cover compares slightly higher than England (72%) and Northern Ireland (76%) but lower than Wales (82%).
The majority (61%) of agricultural land in Scotland was covered by rough grazing and common grazings (3.78 million hectares), a far higher proportion than in other UK countries due to large areas of upland agricultural land in Scotland being suitable only for livestock grazing (Chart C1). In contrast grass covered 22% of agricultural land in Scotland (1.38 million hectares), a far lower proportion than elsewhere in the UK.
It should be noted that in the 2010 June Agricultural Census statistical publication the total agricultural area was reported as 5.64 million hectares, however, this excluded 583,728 hectares of common grazing land.
Total crops and fallow land made up 572,131 hectares in Scotland (9% of total agricultural area), similar to the proportions in Wales (5%) and Northern Ireland (6%) but much lower in comparison with the proportion of crops and fallow land in England (44%).
Total crops and fallow land in Scotland (572,131 hectares) made up 12% of the UK total (4.8 million hectares). The following crops in Scotland accounted for much higher proportions of the UK total; Spring barley (242,364 hectares or 45% of the UK total) and potatoes (31,377 or 23%). The large area of spring barley can be partially accounted for by the demand of the whisky industry in Scotland with spring barley the key ingredient for malting. Conversely, the following crops accounted for much lower proportions of the UK total: Oilseed rape (36,107 hectares or 5%), wheat (111,436 hectares or 6%), orchard and soft fruit (1,962 or 6%).
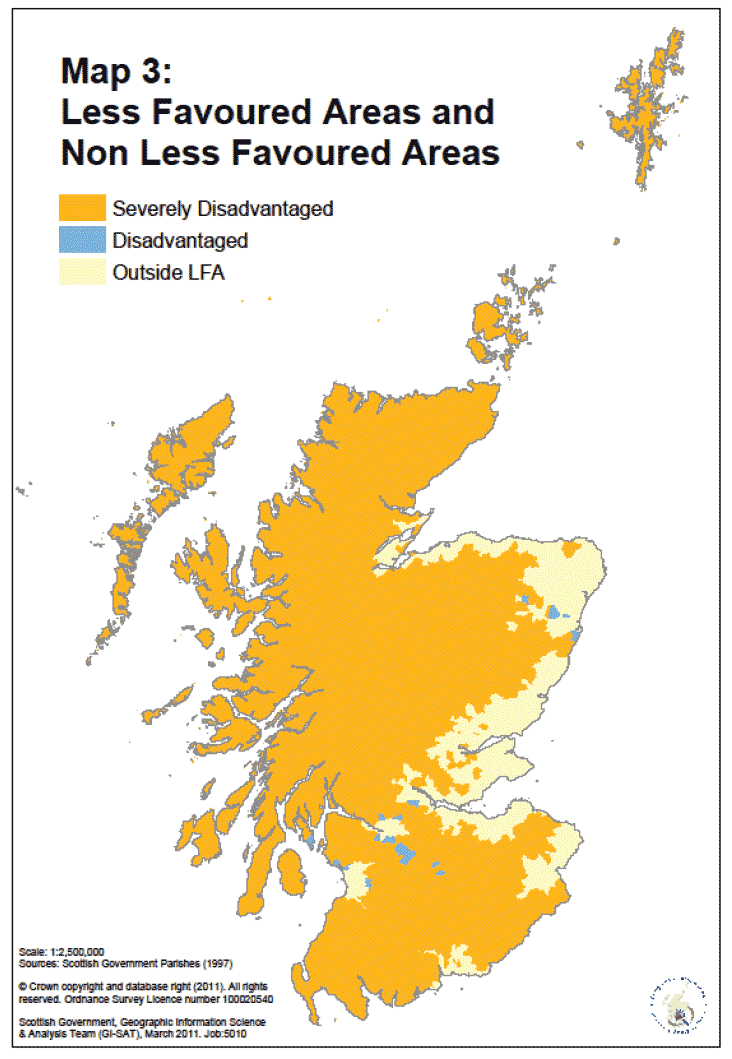
Land use by LFA and non LFA holdings ( Table C3 and Map 3)
Map 3 shows the distribution of agricultural land that is classified as Less Favoured Areas ( LFA). A holding is classified as LFA if 50% or more of its land is assessed as being disadvantaged for subsidy purposes. It can be seen that the vast area of Scotland's agricultural land is classified as "severely disadvantaged" LFA, reflecting the large areas of upland farmland in Scotland, which are only able to support low intensity farming. Non LFA land tends to be located to the east of the country in coastal areas.
Table C3 shows a breakdown of land use by whether it is LFA or not. It shows that in 2010 there were 5.38 million hectares of land located on LFA holdings, accounting for 86% of all agricultural land in Scotland. The vast majority of rough grazing (99% or 3.74 million hectares) is located on LFA holdings, with high proportions of grass (79% or 1.09 million hectares), woodland (88% or 349,653 hectares) and other land (85% or 86,343 hectares) also being located on these holdings.
Table C3 also shows that crops are mainly located on non- LFA holdings. In particular, at least 90% of wheat (103,217 hectares), oilseed rape (34,418 hectares), potatoes (29,365 hectares), beans for combining (4,863 hectares), vegetables for human consumption (15,774 hectares) and orchard and soft fruit areas (1,857 hectares) are on non- LFA holdings. The only crop mainly located on LFA holdings is crops for stockfeeding (69% on LFA holdings or 11,962 hectares).
Land use by geographical area ( Table C4 and Charts C2- C4)
Table C4 presents land use by the 14 regional groupings and 4 agricultural regions (as presented in Map 1). Chart C2 highlights that Highland has the largest proportion of Scotland's agricultural land with 2.17 million hectares (35%) followed by Grampian (11%) and Tayside (10%). These regional groupings also account for the largest proportion of grass and rough grazing in Scotland. Regarding farmed woodland, most is located in the Highlands (39%), Grampian (15%) and Argyll and Bute (11%), while island regions such as Shetland, Orkney and Eileanan an Iar have very small areas of woodland.
Chart C2: Distribution of total agricultural area and other land types by regional grouping, June 2010
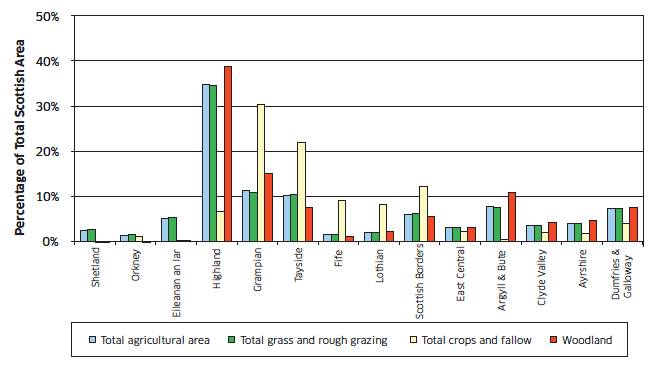
Chart C2 shows that Grampian (30%) and Tayside (22%) have the largest proportion of crop and fallow land in Scotland. In more detail, chart C3 shows that, Grampian accounts for the largest proportion of barley (40%) and oilseed crops (35%). Tayside has the largest area of wheat in Scotland (25,935 hectares or 23% of the national total), with Scottish Borders, Grampian and Lothian accounting for at least 15% each. Crops for stockfeeding are more likely to be grown in areas with high numbers of livestock such as Grampian (5,058 hectares or 22% of the Scotland total) and Dumfries & Galloway (4,671 hectares or 20%).
By contrast very small areas of land are used for crops and fallow on Shetland, Eileanan an Iar and in Argyll and Bute. These areas all account for less than 1% of Scotland's crops and fallow land.
Chart C3: Distribution of crop types by regional grouping, June 2010
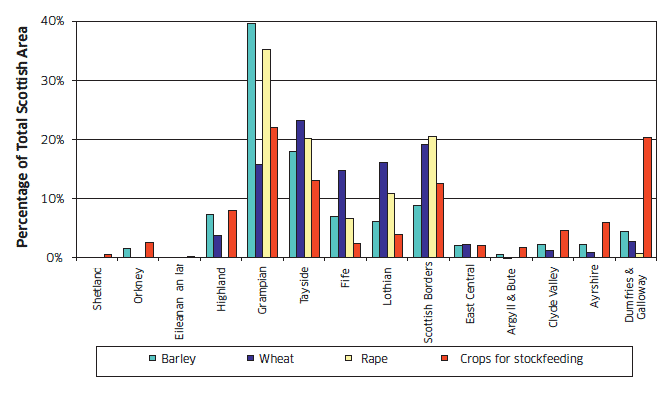
Chart C4: Distribution of potatoes, soft fruit and vegetables by regional grouping, June 2010
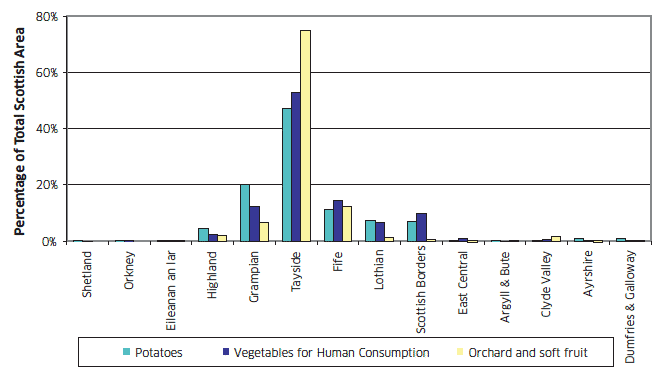
Regarding other crops, chart C4 shows that Tayside has 75% (1,472 hectares) of the land used for orchard and soft fruit in Scotland. Tayside also covers over half (53% or 8,687 hectares) the land used in Scotland to grow vegetables for human consumption and nearly half (47% or 14,767 hectares) of the area used for growing potatoes. Grampian, Fife, Scottish Borders and Lothian are the other regional groupings that contribute greatly to production of these crops.
Distribution of holdings and agricultural area by farm size and region ( Tables C5- C6 and charts C5-C6)
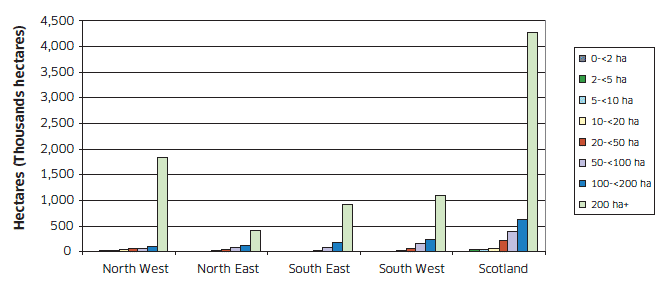
The distribution of agricultural area in Scotland is highly skewed, with a relatively small number of very large holdings accounting for a high proportion of area. There were 4,503 holdings (9% of the total) which were 200 hectares and over in size, accounting for 4.26 million hectares of area (76% of the total). Conversely, there were26,728 holdings (51% of the total) which were less than 10 hectares in size, accounting for 90,602 hectares of area (1.6% of the total). These patterns can be seen by comparing chart C5 and C6.
Chart C5: Number of holdings by region and holding size, June 2010
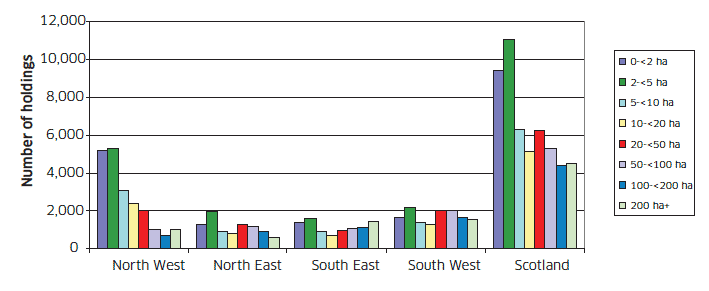
Chart C6: Agricultural area by region and holding size, June 2010
The composition of each regional grouping in terms of farm size distribution differs across Scotland. The regional groupings with the highest proportion of very large holdings, of 200 hectares and over, were Scottish Borders (24%), Argyll and Bute (20%) and Tayside (14%). Just over half (52%) of holdings over 200 hectares are cattle and sheep ( LFA) farms with extensive areas of rough grazing.
The regional groupings with the highest proportion of smaller holdings, of under 10 hectares, were Eileanan an Iar (Western Isles) (83%) and Highland (62%), reflecting the high number of small crofts in these areas. Chart 5 illustrates this with holdings in the North West, where the Highlands and Eileanan An Iar are located, being skewed with far more smaller holdings than larger ones in comparison to other regions.
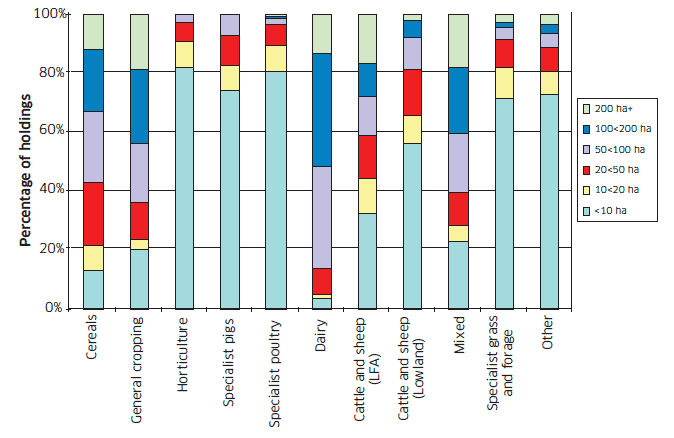
Size of holdings by farm type (Chart C7 and table C7)
Table C7 shows and chart C7 illustrates that farm size distribution also varies within each farm type. The majority of horticulture (80%), specialist poultry (80%), specialist pig (71%), and cattle and sheep (lowland) (56%) holdings are below 10 hectares in size. This reflects the intensive nature of production by these farm types. The majority of specialist grass and forage (71%) holdings are also below 10 hectares in size, although these holdings tend to have little other agricultural activity.
The majority of dairy (86%), general cropping (64%), mixed (60%) and cereal (57%) holdings are above 50 hectares in size, reflecting the structure of the these industries towards larger producers.
The distribution of cattle and sheep ( LFA) holdings by farm size show a varied mix, incorporating large extensive holdings, small holdings and crofts.
Chart C7: Specialist farm types by holding size, June 2010