Economic Report on Scottish Agriculture 2011 Edition
Invalid description field:Agriculture
Part of
All Types
Overall, FBI decreased by £4,905 from £39,271 in 2008/09 to £34,366 in 2009/10. This was caused by a reduction in output of £2,805 (2 per cent) and an increase in input costs of £8,125 (6 per cent) outweighing the increases in subsidies and payments of £5,417 (12 per cent) and income from diversified activities of £608 (20 per cent).
The increase in outputs was due to increases in livestock output. Sheep output increased by £4,184 (32 per cent) from £12,920 in 2008/09 to £17,104 in 2009/10, while cattle output increased by £2,158 (5 per cent) from £39,363 in 2008/09 to £41,521 in 2009/10. These increases reflect the firmer prices for store and finished cattle and sheep in 2009/10 compared to 2008/09.
Overall, cereal output decreased by £6,224 (20 per cent) in 2009/10 compared to 2008/09. This fall reflects the weaker cereal prices observed in 2009/10 compared to 2008/09, as the average area (hectares) of cereals for farms in the survey remained largely unchanged. There was an average decrease of £783 (9 per cent) in the output of potatoes while the value of other crops, such as oilseed rape and fodder crops, increase by £1,344 (17 per cent). The result was an overall decrease in total crop output of £5,662 (12 per cent).
On average, total grants and subsidies increased by £5,417 per farm (12 per cent). This increase was driven primarily by a rise in Single Farm Payment ( SFP) of £4,974, which was mainly due to the favourable exchange rate in September 2009 compared to September 2008.
The large rise in inputs was caused mainly by increases in the average cost of fertiliser, machinery depreciation and labour. Fertiliser increased by £3,119 (22 per cent) from £13,909 in 2008/09 to £17,028 in 2009/10. This reflects the large rise in fertiliser prices over this time period. Machinery depreciation increased by £2,681 (16 per cent), reflecting the increase in the value of these assets. The cost of labour increased by £1,106 (11 per cent), while the cost of feed and fuel remained stable.
Income from diversified activity increased from £3,069 in 2008/09 to £3,676 in 2009/10. This increase is due to both an increase in the number of farms in the survey recording diversified activity and an increase in the average income of farms with diversified activity. Further information is provided later in a separate section on diversification.
Chart B4(a): Selected outputs and inputs, all farm types
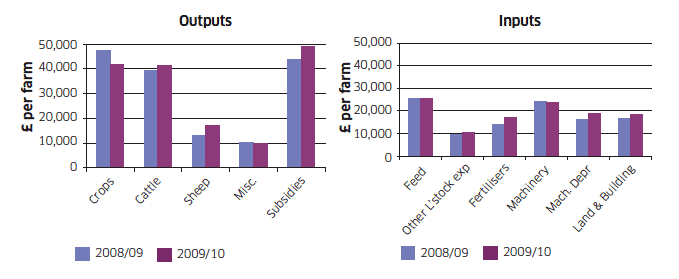
Table B4(a): Average cropping and stocking, output, inputs, and Farm Business Income by type of farm
Type of farm: All Farm Types |
Small |
Medium |
Large |
All Sizes |
||||
|---|---|---|---|---|---|---|---|---|
Number of farms in sample |
178 |
167 |
89 |
99 |
219 |
218 |
486 |
484 |
2008-09 |
2009-10 |
2008-09 |
2009-10 |
2008-09 |
2009-10 |
2008-09 |
2009-10 |
|
Average size of business ( SLR) |
1.3 |
1.3 |
2.5 |
2.5 |
5.1 |
5.1 |
2.8 |
2.8 |
Average size of farm (hectares) |
116 |
106 |
205 |
223 |
507 |
575 |
261 |
283 |
Area of cereals (hectares) |
27 |
25 |
39 |
41 |
51 |
53 |
37 |
37 |
Area of potatoes (hectares) |
0.9 |
1.1 |
2.4 |
2.4 |
5.8 |
5.9 |
2.8 |
2.9 |
Area of other crops (hectares) |
2.4 |
2.6 |
4.9 |
4.5 |
5.5 |
7.3 |
3.8 |
4.5 |
Number of ewes |
89 |
92 |
185 |
171 |
401 |
424 |
209 |
217 |
Number of suckler cows |
24 |
22 |
43 |
42 |
65 |
64 |
41 |
390 |
Number of dairy cows |
2 |
12 |
9 |
10 |
35 |
33 |
14 |
134 |
Number of other cattle |
53 |
51 |
100 |
100 |
171 |
169 |
100 |
99 |
Average output £ per farm |
||||||||
Crops: Cereals |
22,303 |
15,608 |
31,203 |
29,976 |
43,617 |
39,987 |
30,845 |
24,621 |
Potatoes |
1,266 |
1,351 |
1,650 |
2,403 |
23,945 |
21,017 |
8,919 |
8,138 |
Other crops |
5,402 |
5,665 |
9,014 |
7,436 |
11,068 |
15,366 |
7,869 |
9,213 |
Total crop output |
28,971 |
22,624 |
41,867 |
36,815 |
78,629 |
73,371 |
47,633 |
41,972 |
Livestock: Cattle |
20,724 |
22,358 |
39,925 |
40,725 |
67,336 |
70,571 |
39,363 |
41,521 |
Sheep |
6,533 |
8,696 |
10,697 |
12,598 |
23,646 |
31,825 |
12,920 |
17,104 |
Pigs |
0 |
0 |
0 |
0 |
-1 |
0 |
0 |
0 |
Poultry |
75 |
61 |
151 |
110 |
13 |
221 |
66 |
123 |
Milk |
1,872 |
1,596 |
14,611 |
14,299 |
65,042 |
56,036 |
25,034 |
21,949 |
Other livestock |
28 |
-17 |
-3 |
-13 |
40 |
115 |
27 |
28 |
Total livestock output |
29,232 |
32,694 |
65,381 |
67,719 |
156,076 |
158,768 |
77,410 |
80,725 |
Miscellaneous output |
10,298 |
8,895 |
9,130 |
12,942 |
10,950 |
9,878 |
10,332 |
9,873 |
Total Output |
68,501 |
64,212 |
116,378 |
117,476 |
245,656 |
242,016 |
135,375 |
132,569 |
Subsidy and Payments |
24,804 |
27,707 |
42,077 |
46,844 |
73,341 |
82,477 |
43,783 |
49,200 |
(of which LFASS) |
(2,269) |
(2,374) |
(4,279) |
(4,922) |
(8,321) |
(9,351) |
(4,613) |
(5,130) |
(of which SFP) |
(20,191) |
(23,078) |
(34,408) |
(38,715) |
(59,585) |
(67,712) |
(35,626) |
(40,600) |
Average inputs - £ per farm |
||||||||
Feed |
9,224 |
9,285 |
21,238 |
21,533 |
51,749 |
51,466 |
25,359 |
25,440 |
(of which home produced) |
(2258) |
(1977) |
(2,676) |
(3,113) |
(5,854) |
(4,952) |
(3,528) |
(3,160) |
Other livestock expenses |
4,234 |
4,757 |
8,885 |
8,861 |
18,498 |
19,905 |
9,744 |
10,511 |
Seeds |
2,363 |
1,993 |
3,089 |
3,694 |
7,723 |
8,563 |
4,272 |
4,476 |
(of which home grown) |
(286) |
(177) |
(539) |
(419) |
(2557 |
(2478) |
(1086) |
(990) |
Fertilisers |
7,706 |
9,765 |
13,324 |
16,938 |
23,581 |
27,937 |
13,909 |
17,028 |
Other crop expenses |
4,234 |
4,036 |
6,195 |
6,830 |
14,229 |
13,264 |
7,890 |
7,588 |
Labour |
2,681 |
1,945 |
5,457 |
7,05 |
22,122 |
25,634 |
9,628 |
10,735 |
Machinery costs and fuel |
14,373 |
13,544 |
21,547 |
22,395 |
39,836 |
40,137 |
24,032 |
23,909 |
Machinery depreciation |
10,398 |
11,479 |
15,626 |
19,699 |
25,724 |
30,029 |
16,355 |
19,036 |
Land and building costs |
9,806 |
10,218 |
13,505 |
14,744 |
28,207 |
31,927 |
16,551 |
18,248 |
Miscellaneous |
10,414 |
9,316 |
13,746 |
13,597 |
23,184 |
21,522 |
15,216 |
14,108 |
Total average inputs |
75,433 |
76,337 |
122,612 |
135,347 |
254,852 |
270,384 |
142,954 |
151,080 |
Diversification Margin |
3,189 |
3,587 |
1,941 |
2,629 |
3,419 |
4,307 |
3,069 |
3,676 |
of which: Diversification Output |
6,675 |
8,736 |
7,955 |
7,222 |
5,347 |
8,494 |
6,433 |
8,413 |
Diversification Input |
3,487 |
5,149 |
6,015 |
4,594 |
1,928 |
4,187 |
3,364 |
4,737 |
FARM BUSINESS INCOME |
21,060 |
19,169 |
37,783 |
31,603 |
67,564 |
58,416 |
39,271 |
34,366 |