Economic Report on Scottish Agriculture 2011 Edition
Invalid description field:Agriculture
Part of
Other Farm Income Measures
Net Farm Income 5 ( NFI) is defined as the returns to the farmer and spouse for their manual and managerial labour, and for the tenant-type assets invested by them in the business. Although replaced by FBI as the main measure of farm income, NFI is still useful for comparative analysis of agricultural production activities and to preserve longer term trends and it will continue to be published as a secondary measure. This section briefly explains the definitional differences between NFI and FBI and highlights the main effects of these differences. A full analysis of the differences between FBI and NFI was published in "Farm Business Income statistics, 2007/08" in August 2009 and can be accessed at http://www.scotland.gov.uk/Publications/2009/08/26130432/0 .
Table B7: Impact of definitional differences between 2009/10 FBI and NFI results
NFI Definition |
Included in NFI (avg £/farm in 2009/10) |
FBI Definition |
Included in FBI (average £/farm in 2009/10) |
|---|---|---|---|
Includes imputed labour costs for unpaid family and other labour. |
Average imputed labour cost of £7,677 |
No imputed labour costs. FBI reflects income to all those with entrepreneurial interest in the business. |
Not included |
No imputed labour costs for farmer and spouse. NFI reflects income to farmer and spouse alone. |
|||
Includes imputed rental costs for owner-occupied land and buildings. NFI reflects income based on tenant-type capital. |
Average imputed rental cost of £11,572 |
No imputed rental costs. FBI treats tenure as is. |
Not included |
Excludes net ownership charges. NFI reflects income based on tenant-type capital. |
Not included |
Includes net ownership charges. FBI treats tenure as is. |
Average net ownership charges of £6,716 |
Excludes net interest payments. NFI reflects income based on zero level of indebtedness. |
Not included |
Includes net interest payments. FBI reflects actual income of business. |
Average net interest payments of £3,158 |
Excludes diversified income. NFI mainly reflects income based on agricultural production. |
Not included |
Includes additional diversified income. FBI reflects actual income of business, including diversification. |
Average additional diversified income of £3,676 |
Difference between FBI & NFI in 2009/109 |
FBI excludes NFI imputed labour and rental costs of £19,249 FBI includes net ownership charges and net interest payments of £9,874 FBI includes additional diversified income of £3,676 Overall difference to FBI: +£19,249 -9,874+£3,676 = +£13,051 |
||
The following table and chart summarises this information and shows how each of the factors impacted on FBI results in 2008/09 and 2009/10.
Table B8: Relationship between NFI and FBI, National level
£ per farm |
||
|---|---|---|
2008/09 |
2009/10 |
|
NFI |
28,453 |
21,314 |
Positive impact on FBI: |
||
Excluding imputed labour costs |
7,304 |
7,677 |
Excluding imputed rental costs |
11,165 |
11,572 |
Including additional diversified income |
3,069 |
3,676 |
Negative impact on FBI: |
||
Including net ownership charges |
-6,330 |
-6,716 |
Including net interest payments |
-4,389 |
-3,158 |
FBI |
39,271 |
34,366 |
Difference FBI - NFI |
10,818 |
13,051 |
Chart B7: Factor impact on FBI, National level, 2009/10
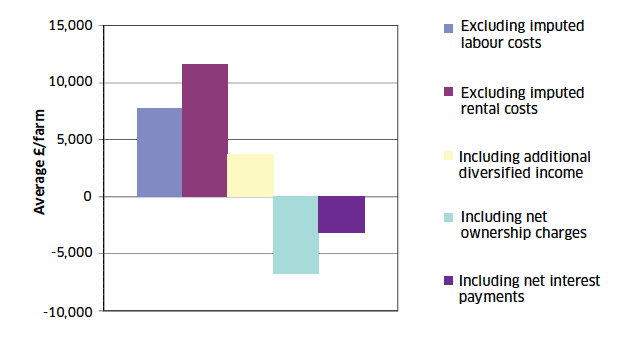
The biggest impact on FBI results was the exclusion of imputed rental costs, which averaged £11,572 per farm at a national level in 2009/10. This impact was high partly because at the national level 58 per cent of farms were owner-occupied and a further 10 per cent had a mixed tenure. This means that 68 per cent of farms represented by the results had some level of artificial rental costs imputed within the NFI measure.
Imputed rental costs were partially offset by the inclusion of net ownership charges within FBI, which averaged £6,716 in 2009/10. This included items such as landlord expenses, building insurance and depreciation costs, which apply to farms of all tenures.
The exclusion of imputed labour costs contributed on average £7,677 to the overall FBI results in 2009/10. The imputation for labour and rental costs introduced a certain amount of subjectivity and inaccuracy to the NFI results. The exclusion of these imputations from FBI will generate a more accurate set of estimates.
On average, farms in the sample incurred net interest payments of £3,158 which have been included in the FBI measure.
In order to establish the income from the entire farm business, FBI includes an average income for diversified activities of £3,676 per farm, which were not included in NFI. Further information on income from diversified activities is given in a separate diversification section.
Another useful income measure is Cash Income which is the difference between total revenue and total expenditure. This measure represents the cash return to the group with an entrepreneurial interest in the business for their manual and managerial labour and on their investment in the business. It excludes notional items such as depreciation and livestock and crop valuation changes.
Table B9 shows NFI and cash income by farm type. It can be seen that, although lower due to its narrower definition, the trends in NFI are very similar to those in FBI. The trends in Cash Income are also similar for most farm types although overall Cash Income increased slightly, compared to a decrease in FBI and NFI. This suggests that non cash items such as depreciation have increased between 2008/09 and 2009/10.
Table B9: FBI, NFI and Cash income by farm type
Type of Farms |
Farm Business Income |
Net Farm Income |
Cash Income |
|||
|---|---|---|---|---|---|---|
2008/09 |
2009/109 |
2008/09 |
2009/10 |
2008/09 |
2009/10 |
|
Specialist Sheep ( LFA) |
16,268 |
29,907 |
9,099 |
18,745 |
21,865 |
36,077 |
Specialist Beef ( LFA) |
29,923 |
38,335 |
19,151 |
30,090 |
33,185 |
42,473 |
Cattle and Sheep ( LFA) |
27,896 |
44,390 |
20,453 |
32,130 |
38,910 |
52,981 |
Cereals |
41,817 |
16,690 |
26,969 |
2,645 |
48,547 |
39,443 |
General Cropping |
60,862 |
18,332 |
44,979 |
-1,294 |
78,980 |
69,238 |
Dairy |
78,446 |
58,746 |
64,050 |
42,696 |
86,629 |
63,937 |
Lowland Cattle and Sheep |
23,969 |
30,294 |
19,167 |
18,821 |
26,287 |
33,865 |
Mixed |
45,317 |
40,185 |
32,461 |
25,351 |
52,5402 |
51,539 |
All Farm Types |
39,271 |
34,365 |
28,453 |
21,314 |
47,676 |
48,935 |