Economic Report on Scottish Agriculture 2011 Edition
Invalid description field:Agriculture
Part of
Net Farm Income, Output and Input by Performance Quartile
Although the main focus of this chapter is Farm Business Income, this section uses Net Farm Income to compare input and output performance of farms by farm type and income. The advantage of NFI for this analysis is that it was designed to allow individual farms of different tenure, business organisation and indebtedness to be compared directly with one another on a consistent basis for the comparative analysis of agricultural production activities.
Table B12 in the Appendix contains information on average outputs, inputs, and NFI according to whether the farm is in the highest or lowest 25 per cent of farms when ranked by NFI, by farm type. Due to the low number of Lowground Cattle and Sheep farms in the sample, figures for this farm type are not shown.
As with Table B4, the table also shows average farm characteristics, such as area and livestock information, which are very important to allow more meaningful comparisons across the quartiles. As discussed earlier, the average input costs and output values for farms will depend, to a degree, on the area of crops or number of livestock on the farm. For example, the average cost of feed on a farm will depend to a large degree on the number of livestock on the farm. It is therefore important to refer to the farm characteristics when comparing outputs, inputs and NFI by quartile.
NFI by farm type for the lowest performing quartiles ranged from -£42,093 for General Cropping farms to -£2,086 for Specialist Beef ( LFA) farms. Conversely, NFI for the highest performing quartiles ranged from £40,358 for General Cropping farms to £132,229 for Dairy farms. The difference between the lowest quartile and the upper quartile of dairy farms was £157,302. A comparison between the two quartiles reveals noticeable differences in two key farm characteristics, with farms in the upper quartile having 70 per cent more dairy cows and obtaining a 30 per cent higher yield per cow. The upper quartile also received an average 1.3p per litre more than farms in the lower quartile.
Although interpretation of the figures is not given in the text for all farm types, Table B12 shows the differences in the relationship between output value and input costs which result in the differences in NFI. A summary of the input/output ratios are shown in Table B13 and Chart B8 (below).
Table B13: Output to Input ratio by farm type, 2009/10
Farm Type |
Lower 25% |
Upper 25% |
All |
|---|---|---|---|
Specialist Sheep ( LFA) |
97 |
155 |
127 |
Specialist Beef ( LFA) |
98 |
150 |
127 |
Cattle and Sheep ( LFA) |
97 |
138 |
124 |
Cereals |
84 |
130 |
102 |
General Cropping |
89 |
119 |
99 |
Dairy |
91 |
130 |
114 |
Mixed |
93 |
144 |
116 |
It can be seen that, for example, for the higher earning groups of Cereal farms, output was 130 per cent of total inputs compared to 102 per cent for the sample average and 84 per cent for the lower quartile. This means that for every £1 spent on inputs, the higher earning Cereal farms produced £1.30p of output, compared to £1.02p for the sample average and 84p for the lower earning farms. This translates into an average NFI of £41,661 for the highest quartile of farms, £2,645 for the sample average and a loss of -£31,789 for the lower earning farms.
Chart B8: Output to Input ratio by farm type, 2009/10
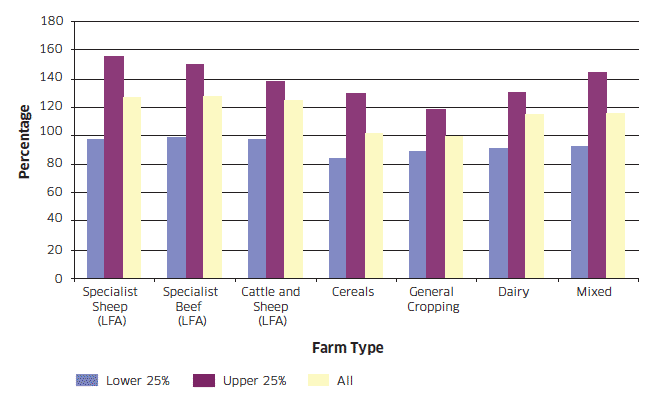
It should be noted however, that a higher output to input ratio does not necessarily lead to a higher NFI when comparing across farm type. NFI depends on both the ratio between, and the absolute levels of, outputs and inputs. This can be seen by looking at the upper quartile of Specialist Sheep ( LFA) farms. The ratio of outputs to inputs is 155 per cent which is the highest of any farm type. However, the NFI of the upper quartile of Specialist Sheep ( LFA) farms is £61,022, which is lower than the upper quartile of a number of the other farm types. This is due to the relatively low absolute value of outputs and inputs.
The individual output and input value categories may also be used to benchmark individual farm businesses to the better and lower performing categories by farm type. Further benchmarking data using farm accounts data is available at: http://www.farmbusinesssurvey.co.uk/benchmarking/Default.aspx