Economic Report on Scottish Agriculture 2011 Edition
Invalid description field:Agriculture
Part of
Diversification
Unlike NFI which is restricted to agricultural activities, FBI represents the return to all farm business activities, including diversification. For the purposes of FBI, diversification is defined as the entrepreneurial use of farm resources for the purpose of producing non-agricultural commodities. This section details the information collected on diversified activities in the Farm Accounts Survey.
Table B16 shows that 46 per cent of farms were engaged in some form of diversified activity in 2009/10, compared to 42 per cent in 2008/09. It should be noted that part of this increase may be due to an improvement in data collection, as the collection of data on diversified activities is still relatively new. In 2009/10, the average income for those farms engaged in diversified income was £7,916 which is slightly higher than the average figure of £7,692 in 2008/09. When averaged across all the farms in the survey, including those with no diversified activity, the figures increase from £3,069 in 2008/09 to £3,676 in 2009/10, reflecting both the higher rate of farms recording diversified activities and the higher average income from diversified activities.
Table B16: Diversified activity and incomes
2008/09 |
2009/10 |
|
|---|---|---|
Total number of farms in survey |
486 |
484 |
Number of farms engaged in diversified activity |
204 |
224 |
Percentage of farms engaged in diversified activity |
42% |
46% |
Average diversified income of farms with diversified activity |
£7,692 |
£7,916 |
Average diversified income across all farms in the survey, including those with no diversified activity |
£3,069 |
£3,676 |
Table B17 shows the number of farms recording diversified activity by farm type along with the average income for those farms recording diversified activity. It can be seen that 20 more farms recorded a diversified activity in 2009/10 compared to 2008/09. This was the result of 11 farms engaged in diversified activity entering to the survey and 37 farms starting to record activity in 2009/10, compared to 11 farms leaving the survey and a further 17 stopping diversified activity. Data on diversified activities was first collected for 2007/08 and is improving in each year of the survey. It is possible that some of the recorded increase in farms with diversified activity between 2008/09 and 2009/10 reflects the improvement in collection rather than a genuine increase in activity.
Table B17: Number of farms and average diversified income by farm type
2008/09 |
2009/10 |
|||||
|---|---|---|---|---|---|---|
Number of farms in Sample |
Number of farms engaged in diversified activity |
Average income per farm (£) |
Number of farms in Sample |
Number of farms engaged in diversified activity |
Average income per farm (£) |
|
Specialist Sheep ( LFA) |
37 |
21 |
8,051 |
41 |
24 |
8,403 |
Specialist Beef ( LFA) |
106 |
29 |
8,307 |
114 |
38 |
5,047 |
Cattle and Sheep ( LFA) |
67 |
30 |
5,548 |
61 |
30 |
9,937 |
Cereals |
81 |
46 |
11,486 |
77 |
50 |
9,931 |
General Cropping |
55 |
25 |
9,911 |
54 |
29 |
8,723 |
Dairy |
55 |
24 |
3,422 |
51 |
21 |
6,058 |
Lowland Cattle and Sheep |
16 |
5 |
3,380 |
17 |
7 |
6,810 |
Mixed |
69 |
24 |
4,903 |
69 |
25 |
6,285 |
Table B18 shows that in 2008/09 the majority of farms engaged in diversified activities recorded only one activity, 42 recorded two activities and 6 recorded three or more activities. The total number of activities increased from 256 in 2008/09 to 278 in 2009/10.
Table B18: Number of diversified activities per farm
2008/09 |
2009/10 |
|||
|---|---|---|---|---|
Number of activities per farm |
Number of farms |
Number of activities |
Number of farms |
Number of activities |
1 |
163 |
163 |
176 |
176 |
2 |
32 |
64 |
42 |
84 |
3+ |
9 |
29 |
6 |
18 |
Number of farms with diversified activities |
204 |
256 |
224 |
278 |
Table B19 and Chart B11, show that the biggest diversified activity by far was renting out farm buildings, accounting for 63 per cent of the total number of diversified activities.
There was a large variation in the margins obtained from different activities. The highest separately identified margin was for renting out buildings, with an average of £5,761. This is followed by income from tourist accommodation (£3,091) and processing and retailing of farm produce (£2,826). The large increase in processing and retailing of farm produce is due to large shifts in the small number of farms engaged in this activity. The "Other Miscellaneous Receipts" heading includes activities such as rural crafts and non-agricultural hirework. These have been aggregated up due to the small number of farms engaged in these activities. A full list of the diversified activities recorded in the Farm Accounts Survey is provided in the Appendix.
Table B19: Number of and income from diversified activities in FAS sample
2008/09 |
2009/10 |
|||
|---|---|---|---|---|
Number |
Average Income |
Number |
Average Income |
|
All |
256 |
6,130 |
278 |
6,378 |
Processing and retailing of farm produce |
6 |
363 |
7 |
2,826 |
Recreation |
22 |
1,147 |
20 |
1,266 |
Renting out buildings - not including tourist accommodation |
162 |
6,390 |
174 |
5,761 |
Tourist Accommodation and Catering |
21 |
2,762 |
18 |
3,091 |
Other Miscellaneous receipts |
45 |
9,970 |
59 |
11,355 |
Chart B11: Average income from diversified activities
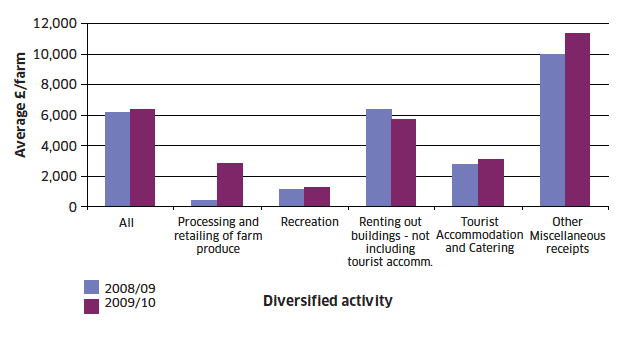
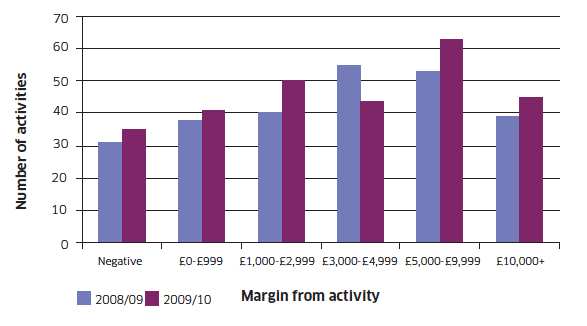
Table B20 and Chart B12 show there was quite a large range in incomes from diversified activities. It can be seen that 35 out of the 278 diversified activities (13 per cent) made a loss. This may be due to an initial investment cost in an activity. The majority of diversified activities made under £5,000. However, in 2009/10, 16 per cent of diversified activities made over £10,000.
Table B20: Range of incomes from diversified activities
Negative |
£0-£999 |
£1,000-£2,999 |
£3,000-£4,999 |
£5,000-£9,999 |
£10,000+ |
All |
|
|---|---|---|---|---|---|---|---|
2008/09 |
31 |
38 |
40 |
55 |
53 |
39 |
256 |
2009/10 |
35 |
41 |
50 |
44 |
63 |
45 |
278 |
Chart B12: Range of incomes from diversified activities