Economic Report on Scottish Agriculture 2011 Edition
Invalid description field:Agriculture
Part of
Mixed
FBI decreased by £5,321 (11 per cent) from £45,317 in 2008/09 to £40,185 in 2009/10. Average total output fell by £879 (1 per cent) and average inputs increased by £6,893 (5 per cent). These factors were offset slightly be an increase in grants and subsidies of £2,163 (4 per cent) and an increase in income from diversified activities of £477 (29 per cent).
The fall in total output was due primarily to a decrease in crop output. Cereal output fell by £8,761 (23 per cent) from £38,914 in 2008/09 to £30,153 in 2009/10, despite cereal areas on farms in the survey remaining stable. This fall reflects the weaker cereal prices observed in 2009/10 compared to 2008/09. The fall in cereal output was offset slightly by an increase in the output value of other crops, such as oilseed rape and fodder crops. Sheep output increased £880 (6 per cent) despite a 15 per cent fall in the average number of ewes on farms in the survey. Milk output increase by £3,072 (127 per cent), which is partly due to one farm with large milk output switching to being classified as a Mixed farm and increasing the average number of dairy cows on Mixed farms in the survey.
On average, total grants and subsidies increased by £2,163 (4 per cent) from £50,108 in 2008/09 to £52,271 in 2009/10. This was caused mainly by an increase in SFP of £3,274 being offset by a reduction in other direct grants and subsidies.
The large rise in inputs was caused mainly by increases in the average cost of fertiliser, land and building costs and machinery depreciation. The cost of fertilisers increased by £3,848 (26 per cent) from £14,702 in 2008/09 to £18,550 in 2009/10, reflecting the large increase in the price of fertilisers. Similarly, land and building costs increased by £1,829 (11 per cent) and machinery depreciation increased by £1,740 (10 per cent), reflecting the increase in asset values. Machinery costs and fuel decreased by £1,955 (8 per cent), reflecting the lower fuel prices in 2009/10 compared to 2008/09.
Average income from diversified activities increased by £477 (29 per cent) from £1,618 in 2008/09 to £2,095 in 2009/10.
Chart B4(i): Selected outputs and inputs, Mixed
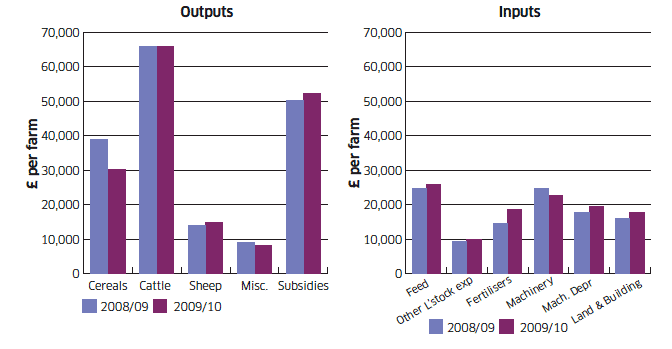
Table B4(i): Average cropping and stocking, output, inputs, and Farm Business Income by type of farm
Type of farm: Mixed |
Small |
Medium |
Large |
All Sizes |
||||
|---|---|---|---|---|---|---|---|---|
Number of farms in sample |
28 |
28 |
10 |
14 |
31 |
27 |
69 |
69 |
2008-09 |
2009-10 |
2008-09 |
2009-10 |
2008-09 |
2009-10 |
2008-09 |
2009-10 |
|
Average size of business ( SLR) |
1.2 |
1.3 |
2.4 |
2.5 |
4.6 |
4.5 |
2.6 |
2.5 |
Average size of farm (hectares) |
89 |
95 |
145 |
188 |
378 |
277 |
198 |
170 |
Area of cereals (hectares) |
30 |
29 |
55 |
59 |
94 |
94 |
56 |
56 |
Number of ewes |
28 |
38 |
159 |
112 |
317 |
273 |
149 |
127 |
Number of suckler cows |
26 |
24 |
50 |
53 |
89 |
82 |
52 |
48 |
Number of other cattle |
102 |
98 |
135 |
145 |
214 |
224 |
146 |
147 |
Average output £ per farm |
||||||||
Crops: Cereals |
17,043 |
13,821 |
42,068 |
31,945 |
68,300 |
54,405 |
38,914 |
30,153 |
Potatoes |
272 |
118 |
303 |
0 |
4,132 |
4,916 |
1,600 |
1,656 |
Other crops |
3,600 |
2,794 |
6,482 |
6,765 |
4,543 |
18,270 |
4,420 |
8,511 |
Total crop output |
20,916 |
16,733 |
48,853 |
38,710 |
76,975 |
77,590 |
44,933 |
40,319 |
Livestock: Cattle |
42,809 |
38,983 |
53,335 |
60,841 |
104,966 |
110,228 |
65,916 |
65,922 |
Sheep |
3,217 |
4,290 |
12,333 |
13,178 |
30,117 |
32,146 |
14,003 |
14,882 |
Pigs |
0 |
0 |
0 |
0 |
0 |
0 |
0 |
0 |
Poultry |
132 |
125 |
0 |
0 |
97 |
1,976 |
97 |
705 |
Milk |
0 |
105 |
0 |
0 |
7,087 |
16,771 |
2,428 |
5,500 |
Other livestock |
-2 |
-143 |
0 |
107 |
107 |
304 |
36 |
46 |
Total livestock output |
46,156 |
43,360 |
65,669 |
74,126 |
142,374 |
161,425 |
82,480 |
87,055 |
Miscellaneous |
6,007 |
5,870 |
6,158 |
7,883 |
15,242 |
12,449 |
9,197 |
8,357 |
Total Output |
73,079 |
65,963 |
120,680 |
120,720 |
234,591 |
251,464 |
136,609 |
135,730 |
Subsidy and Payments |
27,196 |
30,022 |
44,094 |
56,057 |
85,581 |
84,592 |
50,108 |
52,271 |
(of which LFASS) |
(1,500) |
(1,392) |
(2,374) |
(4,143) |
(5,462) |
(3,982) |
(3,008) |
(2,711) |
(of which SFP) |
(23,898) |
(27,333) |
(38,402) |
(48,406) |
(72,214) |
(74,215) |
(42,949) |
(46,223) |
Average inputs - £ per farm |
||||||||
Feed |
16,271 |
14,813 |
18,517 |
24,075 |
39,887 |
44,116 |
24,748 |
25,940 |
(of which home produced) |
(6681) |
(5318) |
(6,697) |
(9,043) |
(14,312) |
(12,893) |
(9,298) |
(8,426) |
Other livestock expenses |
4,593 |
5,206 |
9,025 |
8,678 |
16,529 |
17,725 |
9,445 |
9,876 |
Seeds |
2,412 |
2,712 |
4,338 |
4,237 |
8,262 |
8,682 |
4,748 |
4,916 |
(of which home grown) |
(405) |
(243) |
(1165) |
(478) |
(2404) |
(2158) |
(1221) |
(906) |
Fertilisers |
7,630 |
10,364 |
16,610 |
21,819 |
23,759 |
29,437 |
14,702 |
18,550 |
Other crop expenses |
3,001 |
3,291 |
7,354 |
8,513 |
14,053 |
16,133 |
7,537 |
8,370 |
Labour |
1,701 |
1,343 |
1,927 |
1,981 |
20,578 |
21,922 |
8,207 |
8,138 |
Machinery costs and fuel |
14,013 |
13,487 |
22,160 |
24,989 |
41,452 |
36,195 |
24,817 |
22,862 |
Machinery depreciation |
9,760 |
10,206 |
18,306 |
22,377 |
28,694 |
32,179 |
17,719 |
19,458 |
Land and building costs |
9,342 |
10,490 |
14,341 |
15,818 |
26,405 |
30,383 |
16,049 |
17,877 |
Miscellaneous |
10,985 |
9,383 |
15,363 |
15,095 |
20,643 |
20,312 |
15,048 |
13,925 |
Total average inputs |
79,708 |
81,294 |
127,940 |
147,581 |
240,261 |
257,085 |
143,019 |
149,912 |
Diversification Margin |
426 |
1,164 |
3,938 |
2,526 |
2,141 |
3,302 |
1,618 |
2,095 |
of which: Diversification Output |
797 |
2,686 |
4,036 |
2,829 |
3,020 |
19,388 |
2,116 |
8,135 |
Diversification Input |
371 |
1,521 |
98 |
303 |
879 |
16,086 |
498 |
6,040 |
FARM BUSINESS INCOME |
20,992 |
15,855 |
40,772 |
31,721 |
82,052 |
82,273 |
45,317 |
40,185 |