Economic Report on Scottish Agriculture 2011 Edition
Invalid description field:Agriculture
Part of
Cattle and Sheep ( LFA)
FBI increased by £16,494 (59 per cent) from £27,896 in 2008/09 to £44,390 in 2008/09. Total outputs increased by £7,735 (9 per cent) and grants and subsidies increased by £8,019 (14 per cent) compared to an increase in input cost of £1,318 (1 per cent).
Average crop output fell by £2,218 (29 per cent) from £7,614 to £5397, primarily due to a £1,815 fall in cereal output. The main driver behind the increase in livestock output was the large increase of £11,888 (38 per cent) in sheep output. This reflects the strong prices for sheep and also the fact that there was an 8 per cent increase in the number of ewes held on farms in the survey. Livestock output would have been greater but for a fall of £4,726 fall in milk output. This was caused by one farm with a large milk output switching from being classified as Cattle and Sheep ( LFA) in 2008/09 to being classified as a Dairy farm in 2009/10.
Total grants and subsidy payments increased by £8,019 (14 per cent) from £58,189 in 2008/09 to £66,207 in 2009/10. This increase was caused by a rise in Single Farm Payment ( SFP) of £5,715, reflecting a more favourable exchange rate in 2009, and a rise in LFASS of £1,490, partly due to an increase in the average size of farms in the sample.
Total input costs remained relatively stable (up 1 per cent) at £123,671. The largest increase was in machinery depreciation which increased £1,454 (10 per cent) to £15,340 in 2009/10. There was also an average increase in fertiliser costs of £582 (6 per cent). Miscellaneous costs, which include ownership expenses and interest, decreased £1,577 (11 per cent).
Income from diversified activities increased by £2,059 (104 per cent) from £1,988 in 2008/09 to £4,047 in 2009/10. This increase was caused by a large increase in the average income from diversified activities as the number of Cattle and Sheep ( LFA) farms engaged in these activities was the same in both years. Further details are provided later in a separate section on diversification.
Chart B4(d): Selected outputs and inputs, Cattle and Sheep ( LFA)
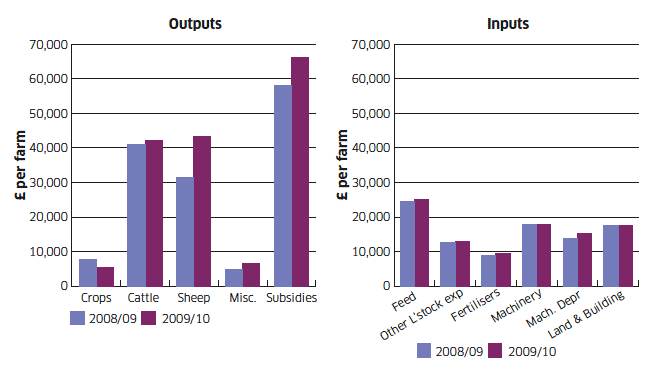
Table B4(d): Average cropping and stocking, output, inputs, and Farm Business Income by type of farm
Type of farm: |
Small |
Medium |
Large |
All Sizes |
||||
|---|---|---|---|---|---|---|---|---|
Number of farms in sample |
13 |
12 |
11 |
12 |
43 |
37 |
67 |
61 |
2008-09 |
2009-10 |
2008-09 |
2009-10 |
2008-09 |
2009-10 |
2008-09 |
2009-10 |
|
Average size of business ( SLR) |
1.4 |
1.5 |
2.3 |
2.4 |
5.9 |
5.9 |
3.8 |
3.8 |
Average size of farm (hectares) |
173 |
210 |
357 |
340 |
908 |
995 |
575 |
618 |
Area of Cereals (hectares) |
4 |
4 |
4 |
6 |
16 |
13 |
10 |
9 |
Number of ewes |
211 |
239 |
418 |
388 |
860 |
956 |
572 |
616 |
Number of suckler cows |
27 |
25 |
39 |
48 |
97 |
93 |
65 |
63 |
Number of other cattle |
41 |
32 |
45 |
58 |
170 |
144 |
107 |
91 |
Average output £ per farm |
||||||||
Crops: Cereals |
1,747 |
1,969 |
3,058 |
2,147 |
8,547 |
5,205 |
5,403 |
3,588 |
Potatoes |
1,130 |
702 |
0 |
0 |
331 |
398 |
554 |
434 |
Other crops |
842 |
156 |
1,802 |
711 |
2,162 |
2,447 |
1,658 |
1,375 |
Total crop output |
3,719 |
2,827 |
4,861 |
2,857 |
11,040 |
8,050 |
7,614 |
5,397 |
Livestock: Cattle |
18,027 |
15,637 |
17,750 |
29,508 |
63,501 |
64,681 |
41,116 |
42,068 |
Sheep |
12,529 |
17,600 |
14,087 |
21,340 |
49,252 |
68,713 |
31,442 |
43,330 |
Pigs |
0 |
0 |
0 |
0 |
-3 |
0 |
-2 |
0 |
Poultry |
560 |
512 |
45 |
49 |
-6 |
0 |
194 |
182 |
Milk |
0 |
0 |
0 |
0 |
9,290 |
0 |
4,726 |
0 |
Other livestock |
63 |
10 |
0 |
-8 |
71 |
384 |
58 |
191 |
Total livestock output |
31,178 |
33,759 |
31,882 |
50,889 |
122,105 |
133,778 |
77,533 |
85,770 |
Miscellaneous |
5,272 |
5,452 |
3,201 |
9,617 |
5,200 |
6,433 |
4,924 |
6,639 |
Total Output |
40,169 |
42,038 |
39,944 |
63,363 |
138,344 |
148,261 |
90,071 |
97,806 |
Subsidy and Payments |
22,883 |
26,981 |
38,940 |
45,457 |
87,551 |
100,497 |
58,189 |
66,207 |
(of which LFASS) |
(4,524) |
(5,559) |
(7,879) |
(9,784) |
(15,993) |
(17,935) |
(10,862) |
(12,352) |
(of which SFP) |
(14,799) |
(16,437) |
(25,975) |
(30,389) |
(62,914) |
(73,190) |
(40,952) |
(46,667) |
Average inputs - £ per farm |
||||||||
Feed |
8,612 |
7,984 |
11,662 |
16,371 |
39,121 |
40,079 |
24,589 |
25,164 |
(of which home produced) |
(1930) |
(1208) |
(502) |
(2,184) |
(6,129) |
(4,316) |
(3,851) |
(2,900) |
Other livestock expenses |
5,265 |
5,443 |
9,498 |
8,526 |
18,745 |
19,600 |
12,757 |
12,917 |
Seeds |
935 |
673 |
917 |
1,570 |
2,480 |
2,481 |
1,718 |
1,713 |
(of which home grown) |
(0) |
(0) |
(0) |
(34) |
(263) |
(154) |
(134) |
(81) |
Fertilisers |
3,779 |
4,267 |
5,178 |
6,853 |
13,583 |
14,150 |
8,976 |
9,558 |
Other crop expenses |
1,085 |
1,067 |
1,117 |
2,530 |
2,996 |
2,570 |
2,062 |
2,053 |
Labour |
215 |
55 |
3,090 |
3,381 |
16,594 |
17,197 |
8,978 |
9,035 |
Machinery costs and fuel |
9,441 |
9,660 |
11,727 |
13,462 |
25,203 |
25,258 |
17,802 |
17,963 |
Machinery depreciation |
7,392 |
7,454 |
8,719 |
13,743 |
19,787 |
21,366 |
13,896 |
15,350 |
Land and building costs |
10,499 |
10,453 |
10,231 |
11,760 |
24,699 |
24,563 |
17,681 |
17,602 |
Miscellaneous |
7,978 |
7,333 |
10,543 |
8,710 |
18,851 |
17,008 |
13,894 |
12,317 |
Total average inputs |
55,200 |
54,389 |
72,681 |
86,906 |
182,058 |
184,272 |
122,353 |
123,671 |
Diversification Margin |
423 |
533 |
-2,963 |
-500 |
4,501 |
8,046 |
1,988 |
4,047 |
of which: Diversification Output |
704 |
790 |
3,830 |
2,111 |
8,064 |
9,971 |
4,917 |
5,522 |
Diversification Input |
281 |
257 |
6,793 |
2,611 |
3,563 |
1,925 |
2,929 |
1,475 |
FARM BUSINESS INCOME |
8,276 |
15,163 |
3,239 |
21,413 |
48,337 |
72,532 |
27,896 |
44,390 |