Health and social care - staff experience: report 2021
Independent report by Webropol providing detailed information and analysis of staff experience in health and social care across Scotland during 2021.
Appendix 8: Demographic Profile
Demographic questions have been introduced to the iMatter survey in 2021. A slightly different set of demographic questions were asked on the 2020 Everyone Matters Pulse Survey.
The demographic questions were optional within the survey and typically 7,000 – 11,000 staff (6% - 11%) chose not to answer one or more of these questions.
Sex
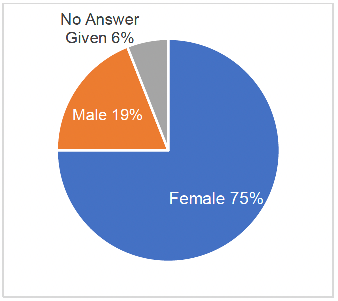
Among those responding to iMatter 2021, 75% are female and 19% are male. 6% of those taking part chose not to answer this question.
In response to the question "Do you consider yourself to be trans or have a trans history?" less than 1% say they are trans, 93% say they are not and 7% chose not to answer the question.
As at September 2021, official statistics showed that 79% (headcount) of NHSScotland workforce are women.
Sexual Orientation
| Straight/Heterosexual | 87% |
|---|---|
| Gay or Lesbian | 2% |
| Bisexual | 1% |
| Prefer to self-describe | 1% |
| No Answer Given | 8% |
87% of staff describe their sexual orientation as straight/heterosexual.
8% of staff chose not to answer this question. However, among the 1% who said they prefer to self-describe, many used the 'please write in' box on the survey to say that they didn't want to answer the question, often saying that they felt they it was not relevant to be asked this question.
This differs from the 59% of the NHSScotland staff that declared their sexual orientation to be heterosexual, 2% declared to be gay, lesbian or bisexual while 39% declined to declare or unknown. The Scottish Surveys Core Question (2017) estimates 3% of the Scottish population are LGBT.
Maternity/Parental Leave
Among those taking part in iMatter 2020, 4% said they had been on maternity/parental or shared parental leave in the last 12 months, 88% said they had not and 8% chose not to answer the question.
Disability and Illness
In response to the specific question about disability*, 5% of staff said they considered themselves disabled, 88% said 'no' and 6% chose not to give an answer.
As at March 2021, 1.1% of staff working in NHS Scotland declared a disability. In the 2011 census, one in five of Scotland's population reported long-term disability; about 7% of the population declared a physical disability.
*Question asked: Disability: The Equality Act 2010 describes a disabled person as: '...anyone who has a physical, sensory or mental impairment, which has a substantial and long-term adverse effect on their ability to carry out normal day-to-day activities'. Do you consider yourself to be disabled within the definition of the Equality Act 2010?
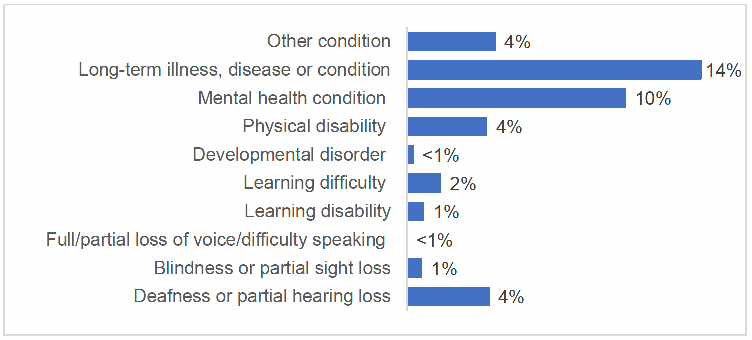
Staff were then asked "Do you have any of the following, which have lasted, or are expected to last, at least 12 months?" 85,212 staff answered the question and percentages shown below are based on those people. Among the 4% who selected 'Other condition' many mentioned hidden illnesses and conditions that work colleagues may not be aware of including asthma, diabetes, arthritis and other rheumatic diseases, and menopause.
22,948 staff did not answer this question. It is reasonable to assume the majority of these do not have any conditions lasting 12 months or more. Therefore, as a proportion of all staff the percentages reported below are likely to be reduced by c.20%.
Age
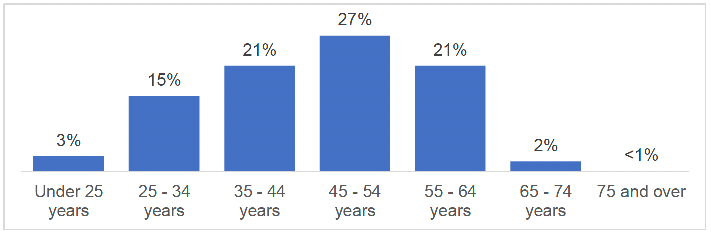
11% of staff (11,414 people) chose not to provide their age. Of those that did, the majority of staff are aged between 35 and 64 years.
As at September 2021, 27% (headcount) of NHSScotland workforce are under 34 years, 49% are aged 35 – 54 years and 24% of all staff are over 55 years.
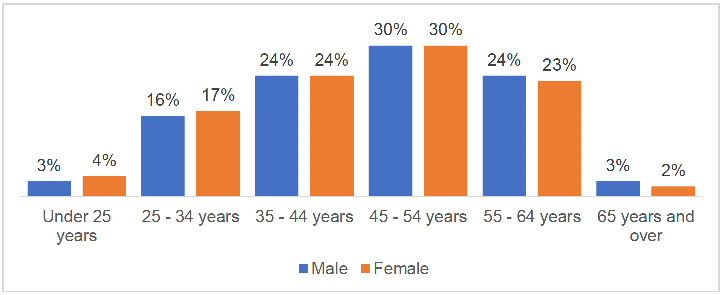
Among those staff who gave their age and identified as male or female, the age profile is very similar, with female staff very slightly younger than male staff.
Marital/Civil Partnership Status
Half of staff taking part in iMatter 2021 say they are married, and a quarter say they have never married or registered a civil partnership. The remaining quarter includes 9% who chose not to answer the question.
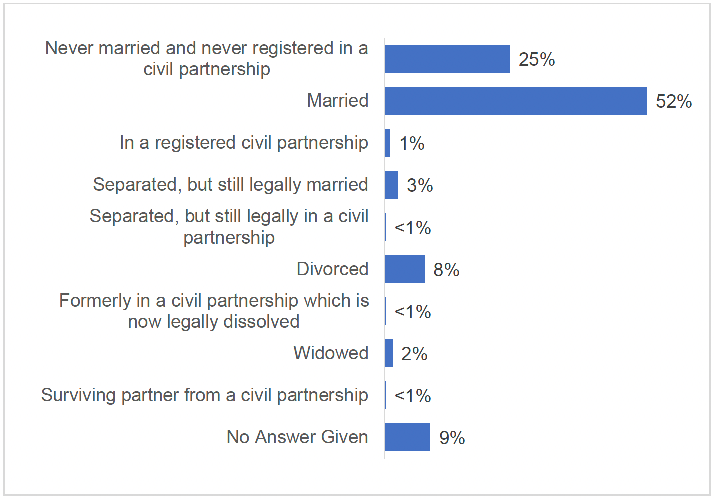
In Scotland, 2011 census indicated that 45% of people aged 16 and above were either in marriage or civil partnerships.
Religion
Half of staff taking part in iMatter 2021 say they have no religion. 21% of staff are Church of Scotland and 14% are Roman Catholic. 7% chose not to answer the question.
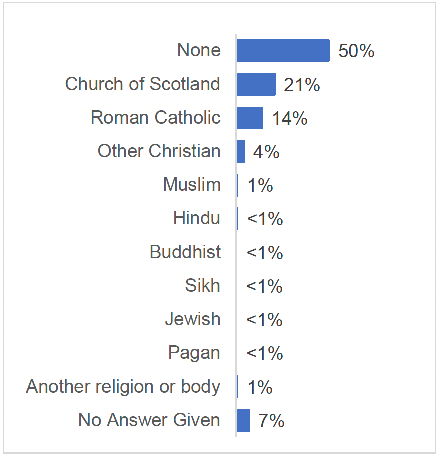
32% of staff employed by NHSScotland declared their religion as Christian, of which Roman Catholic and Church of Scotland made up of 16% and 10% of this respectively. 28% declared they follow no religion.
The most prevalent responses among the responses given to the 'write in' options are:
Another religion or body
- Agnostic
- Atheist
- Humanist
- Jehovah's Witness
- Non-denominational
- Orthodox
Muslim
- Sunni
Other Christian
- Anglican
- Baptist
- Born again Christian
- Church of England
- Christian
- Episcopal
- Evangelical
- Free Church (of Scotland)
- Methodist
- Pentecostal
- Protestant
Ethnicity
90% of staff describe their ethnicity as 'white' with the majority of those people saying they are Scottish. 4% of staff describe their ethnicity as other than white and 6% chose not to answer the question.
What is your ethnic group?
White 90%
- Scottish 85%
- Other British 10%
- Irish 2%
- Showman / Showwoman <1%
- No Answer Given 1%
- Polish 1%
- Gypsy / Traveller <1%
- Roma <1%
- Other white ethnic group 2%
Mixed or multiple ethnic groups 1%
Asian, Scottish Asian or British Asian 2%
- Pakistani, Scottish Pakistani or British Pakistani 19%
- Bangladeshi, Scottish Bangladeshi or British Bangladeshi 2%
- Other 17%
- Indian, Scottish Indian or British Indian 44%
- Chinese, Scottish Chinese or British Chinese 11%
- No Answer Given 6%
African, Scottish African or British African 1%
Caribbean or Black <1%
Other ethnic group <1%
- Arab, Scottish Arab or British Arab 26%
- No Answer Given 18%
- Other 56%
No Answer Given 6%
68% of NHSScotland workforce declared their ethnicity as White, <1% Mixed, 2% Asian, 1% Black and <1% as Other. Ethnicity is unknown or not declared for 28% of staff.
Contact
Email: Victoria.freeland@gov.scot