Government expenditure & revenue Scotland 2024-25
Government Expenditure and Revenue Scotland (GERS) is an Accredited Official Statistics publication. It estimates the revenue raised in Scotland and the cost of public services provided for Scotland.
Part of
2 North Sea Revenue
Introduction
In GERS, the term North Sea is used to refer to all offshore oil and gas activity. North Sea revenue in GERS comes from four sources: petroleum revenue tax, corporation tax, licence fees, and the energy profits levy.
Table 2.1 shows the revenue raised from each component of North Sea revenue since 2022-3, when UK North Sea revenue was £9.9 billion, a near record high. Revenue fell back in 2023-24 and 2024-25, when it was £4.6 billion. This reflects the path of oil and gas prices over recent years.
| Source of Revenue | 2022-23 | 2023-24 | 2024-25 |
|---|---|---|---|
| Licence fees | 51 | 51 | 48 |
| North Sea corporation tax | 5,834 | 2,685 | 2,077 |
| Petroleum revenue tax | -234 | -427 | -350 |
| Energy profits levy | 4,256 | 3,135 | 2,785 |
| Total | 9,907 | 5,444 | 4,560 |
North Sea revenue is subject to annual fluctuations and is driven by a number of factors, including the oil price, the sterling dollar exchange rate, production, operating expenditure, capital investment, and the prevailing fiscal regime.
Oil prices broadly trended downwards across 2024-25 while gas prices rose over the year. The oil price fell from around $90 per barrel in April 2024 to around $65 per barrel in March 2025, whilst gas prices began the year at 69p per therm and ended at around 100p.[18] [19]
Overall North Sea production of oil and gas fell by 8% in 2024-25 to 60 million tons of oil equivalent.[20] The decline was twice as fast for natural gas than for oil with gas production down 10% compared to 2023-24 and oil production down 5%.
In 2024 total expenditure on the UK Continental Shelf increased by 6.5% in real terms compared to 2023 to stand at £16.2 billion. The increase was driven by increased capital and decommissioning expenditure, which increased by 27% and 17% respectively in real terms. Operating costs and exploration and appraisal expenditure fell by 4% and 70% respectively, although the latter is a represents only a small part of overall expenditure and as such had a more limited impact on the overall change.[21]
The UK fiscal regime in 2024-25 consisted of offshore ring fence corporation tax (RFCT) at 30%, petroleum revenue tax (PRT) at 0% and a supplementary charge (SC) of 10%, and the energy profits levy (EPL) at 38%.[22] The combined rate of tax on profits is 78%, although there exist a number of allowances, most notably for capital expenditure that mean companies face a different effective rate if they are making new investments in production and decarbonisation. The EPL is currently scheduled to end on 31 March 2030, after which a new permanent regime is planned to come into effect. However, under the Energy Security Investment Mechanism (ESIM), should both the six-month average oil and gas prices fall below preset thresholds, the EPL would immediately cease to apply ahead of the 2030 date.[23] The UK Government is currently consulting on a fiscal regime to follow on after EPL expires.[24]
As shown in Table 2.1, over half of oil and gas revenue in 2023-24 was raised via the EPL. The table also shows that PRT receipts are negative. This reflects the fact that, although companies no longer pay PRT, they can still claim refunds on PRT paid in previous years against current trading losses and decommissioning spending. As a result, PRT receipts will only be negative in the future under the current tax regime.[25]
Scotland’s Share of North Sea Revenue
In the ONS’s Regional Accounts, the UK continental shelf is not allocated to specific geographic regions, but is considered a separate region of the UK (the extra-regio territory). As such, an assumption as to Scotland’s share of the North Sea needs to be made in GERS.
Two estimates of Scotland’s share of North Sea revenue are shown in GERS:
- An illustrative geographical share
- A population share
These are discussed below.
An Illustrative Geographical Share
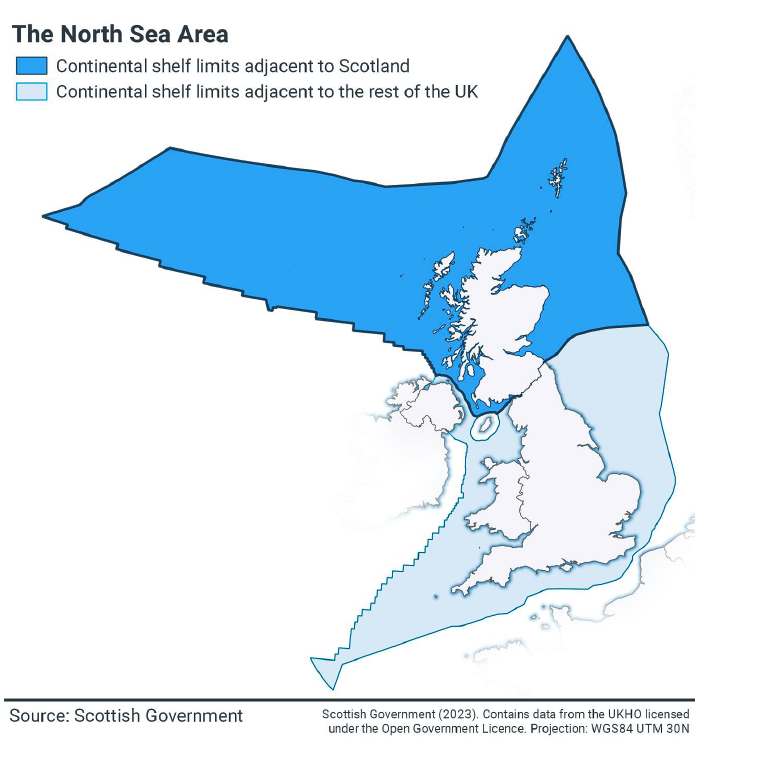
The most common approach to estimating North Sea revenue is to apportion a share of North Sea revenue to Scotland on the geographical location of oil and gas fields. In order to estimate this share, GERS uses the share reported in the ONS Country and Regional Public Sector Finances publication. The estimate is based on the median line principle as employed in 1999 to determine the boundary between Scotland and the rest of the UK for fishery demarcation purposes. Other alternatives are possible. Production, costs and revenue are allocated on a field-by-field basis to either the rest of the UK or Scotland using this boundary.
Table 2.2 shows Scotland’s illustrative geographical share of UK North Sea revenue, broken down by licence fees, corporation tax, petroleum revenue tax, and the energy profits levy. Scotland’s share of UK revenue rose in 2023-24, likely reflecting the increased profitability of oil fields relative to gas fields.
| Source of Revenue | 2022-23 | 2023-24 | 2024-25 |
|---|---|---|---|
| UK revenue (£million) | 9,907 | 5,444 | 4,560 |
| Licence fees | 51 | 51 | 48 |
| North Sea corporation tax | 5,834 | 2,685 | 2,077 |
| Petroleum revenue tax | -234 | -427 | -350 |
| Energy Profits Levy | 4,256 | 3,135 | 2,785 |
| Scottish geographical revenue (£ million) | 7,891 | 4,873 | 4,077 |
| Licence fees | 41 | 45 | 43 |
| North Sea corporation tax | 4,626 | 2,391 | 1,845 |
| Petroleum revenue tax | -184 | -349 | -287 |
| Energy Profits Levy | 3,408 | 2,786 | 2,476 |
| Scottish share of UK (%) | 79.7% | 89.5% | 89.4% |
| Licence fees | 80.2% | 89.1% | 89.0% |
| North Sea corporation tax | 79.3% | 89.0% | 88.8% |
| Petroleum revenue tax | 78.8% | 81.8% | 82.1% |
| Energy Profits Levy | 80.1% | 88.9% | 88.9% |
Scotland’s estimated geographical share of the North Sea sector, used in this report, is highlighted in the figure below.
Population Share
An alternative approach to North Sea revenue is to view it as a non-identifiable UK revenue, in which case a population share may be apportioned to Scotland. Table 2.3 shows a population share of North Sea revenue.
| Revenue | 2022-23 | 2023-24 | 2024-25 |
|---|---|---|---|
| Total North Sea revenue (£ million) | 9,907 | 5,444 | 4,560 |
| Scotland’s population share (£ million) | 798 | 437 | 364 |
| Scotland’s share of North Sea revenue (%) | 8.1% | 8.0% | 8.0% |
Contact
Email: economic.statistics@gov.scot