Government expenditure & revenue Scotland 2024-25
Government Expenditure and Revenue Scotland (GERS) is an Accredited Official Statistics publication. It estimates the revenue raised in Scotland and the cost of public services provided for Scotland.
Part of
1 Public Sector Revenue
Introduction
This chapter provides detailed estimates of Scottish public sector revenue.
The majority of public sector revenue payable by Scottish residents and enterprises is collected at the UK level. Generally it is not possible to identify separately the proportion of revenue receivable from Scotland. GERS therefore uses a number of different methodologies to apportion revenue to Scotland. These are discussed in the methodology paper on the GERS website.[11]
Following the implementation of the Scotland Act 2012 and Scotland Act 2016, an increasing amount of revenue is being devolved to the Scottish Parliament, and direct Scottish measures of these revenues are becoming available. To date, landfill tax, property transaction taxes, and non-savings non-dividend income tax have been devolved. Chapter 4 provides more information on current and future devolved taxes. Note that the income tax figures in this chapter cover all income tax, whilst those in Chapter 4 cover only non-savings and non-dividend income tax.
For taxes where there is no direct measure of Scottish revenue, GERS uses a set of data sources and methodologies developed over a number of years following consultation with, and feedback from users and experts. In some cases, a variety of methodologies could be applied, each leading to different estimates of public sector revenue in Scotland. Table A.5 in Annex A provides analysis of the confidence intervals around revenue estimates based on survey data.
GERS reports tax and non-tax revenue separately. Non-tax revenues are primarily non-cash items such as capital consumption, included for accounting purposes in gross operating surplus, and the operating surplus of public corporations such as Scottish Water. These are discussed in more detail below.
Revenue 2024-25
Table 1.1 reports estimated public sector revenue in Scotland and the UK in 2024‑25. The contribution of each element of revenue to the Scottish total, and the proportion of UK revenue raised in Scotland, are also included in the table. The three largest taxes, income tax, national insurance contributions, and value added tax account for around two thirds of total non-North Sea revenue.
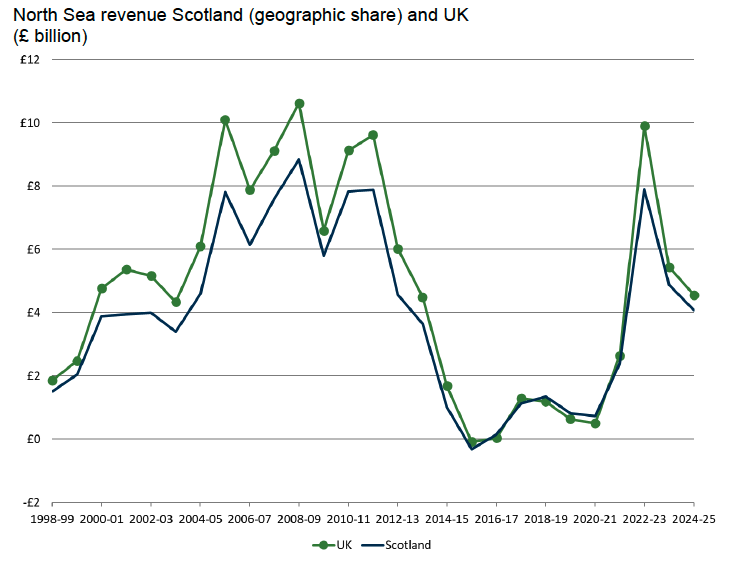
Overall, Scotland raised £91.4 billion in 2024-25, or 8.0% of total UK revenue. This represents a fall from a share of 8.2% in 2023-24, reflecting the decline in North Sea revenue, which fell to £4.1 billion from £4.9 billion in 2023-24. Scotland has around 90% of total UK North Sea revenue. This is discussed further in Chapter 2.
Excluding the North Sea revenue, Scotland’s revenue increased to £87.3 billion, an increase of 2.5%, and weaker than UK growth of 3.6%. Weaker growth was seen in a number of areas, including interest income from student loans, Council Tax, and to a lesser degree National Insurance Contributions.
For student loans, this will partly reflect differences in devolved funding arrangements. In Scotland, the interest rate for all student loans is set at the lower of the Retail Price Index or the Bank of England base rate plus one percent. The interest rate charged on Scottish loans fell between 2023-24 and 2024-25 and is currently at 4.3%. In contrast, interest rates for student loans in England and Wales vary depending on the borrower’s plan type, and can be up to 7.3%.[12]
For Council Tax, this reflects the decision to freeze Council Tax in Scotland in 2024‑25, whilst in England average Council Tax rates increased by 5.1%.[13]
For National Insurance Contributions (NICs), the difference reflects the differential impact of the reduction in employee NICs in 2024-25. Employee NICs receipts make up a larger share of overall NICs receipts in Scotland than the UK, and so the UK Government’s decision to reduce employee NICs has led to relatively larger fall in NICs in Scotland.
In order to report revenue on a National Accounts basis, an international reporting standard used by governments, a number of accounting adjustments are included in the total revenue estimate. These are primarily symmetric adjustments that also form part of expenditure, and therefore have little impact on the net fiscal balance.
| Source of Revenue | Scotland | UK | Scotland as % of UK | |
|---|---|---|---|---|
| £ million | % of total non-North Sea taxes | £ million | ||
| Income tax (gross of tax credits) | 20,714 | 27.6% | 305,059 | 6.8% |
| National insurance contributions | 12,904 | 17.2% | 172,416 | 7.5% |
| Value added tax | 15,234 | 20.3% | 172,696 | 8.8% |
| Onshore Corporation tax | 5,855 | 7.8% | 95,726 | 6.1% |
| Fuel duties | 2,159 | 2.9% | 24,675 | 8.7% |
| Non-domestic rates | 3,263 | 4.3% | 31,854 | 10.2% |
| Council tax | 2,994 | 4.0% | 47,446 | 6.3% |
| VAT refunds | 2,626 | 3.5% | 29,344 | 8.9% |
| Capital gains tax | 456 | 0.6% | 13,063 | 3.5% |
| Inheritance tax | 450 | 0.6% | 8,286 | 5.4% |
| Reserved stamp duties | 240 | 0.3% | 20,602 | 1.2% |
| Scottish land & buildings transaction tax | 923 | 1.2% | 923 | 100% |
| Scottish landfill tax | 53 | 0.1% | 53 | 100% |
| Air passenger duty | 294 | 0.4% | 4,195 | 7.0% |
| Tobacco duties | 808 | 1.1% | 7,908 | 10.2% |
| Alcohol duties | 1,143 | 1.5% | 12,575 | 9.1% |
| Insurance premium tax | 635 | 0.8% | 8,967 | 7.1% |
| Vehicle excise duties | 652 | 0.9% | 8,378 | 7.8% |
| Environmental levies | 937 | 1.2% | 8,212 | 11.4% |
| Other taxes1 | 2,787 | 3.7% | 35,607 | 7.8% |
| Total Non-North Sea taxes | 75,127 | 100% | 1,007,985 | 7.5% |
| North Sea (Population share) | 364 | - | 4,560 | 8.0% |
| North Sea (Geographical share) | 4,077 | - | 4,560 | 89.4% |
| Interest and dividends | 3,115 | - | 42,798 | 7.3% |
| Gross operating surplus | 8,874 | - | 79,241 | 11.2% |
| Other receipts | 184 | - | 1,955 | 9.4% |
| Total excluding North Sea | 87,300 | - | 1,131,979 | 7.7% |
| Total including population share of North Sea | 87,664 | - | 1,136,539 | 7.7% |
| Total including geographical share of North Sea | 91,376 | - | 1,136,539 | 8.0% |
| of which: revenue accounting adjustments | 9,627 | - | 99,652 | 9.7% |
1 A description of the other taxes line is provided in the detailed methodology paper on the GERS website.
Unlike the expenditure accounting adjustments, which are shown in a separate expenditure line, the revenue accounting adjustments are included within different revenue lines, as is set out in Table A.9 in Annex A. In order to aid transparency, a revenue accounting adjustments line is shown at the bottom of Table 1.1 and 1.4. This is a sub-total of revenue, and is not additional to the revenue totals reported in these tables.
Scotland’s share of UK total non-North Sea revenue in 2024-25 was 7.7% which is 0.3 percentage points lower than Scotland’s share of the UK population. In general, Scotland’s share of revenue has been declining over time in line with its declining population share.
Scotland’s share of most large revenues is close to either its population or GDP share. However, there are some exceptions to this, discussed below.
Revenues where Scotland’s share of UK revenue is relatively low are those associated with property or assets, such as capital gains tax (3.5%), and inheritance tax (5.4%). This reflects the fact that properties and assets in Scotland tend to have lower values than the UK average.[14] Scotland’s share of income tax (6.8%) is also relatively low. In part, this reflects the increasingly progressive nature of income tax, following the introduction of the additional rate of income tax and increases in the personal allowance. Scotland has relatively fewer top rate tax payers, with only around 5% of the UK total.
Revenues where Scotland has a relatively large share include gross operating surplus (GOS), which includes the surpluses of public corporations. Scotland is estimated to generate approximately 11.2% of UK public sector GOS, higher than Scotland’s population share. Scotland’s GOS includes Scottish Water, which is a large contributor to UK public corporations’ GOS. The equivalent water companies in England and Wales are outside the public sector and hence do not contribute to UK GOS.
Scotland tends to also have relatively high shares of duties associated with tobacco and alcohol. This reflects the greater incidence of smoking in Scotland,[15] and also the fact that Scotland has higher consumption of spirits than the rest of the UK.[16]
Table 1.2 below shows Scotland’s share of the largest UK revenues.
| Source of Revenue | 2022-23 | 2023-24 | 2024-25 |
|---|---|---|---|
| Income Tax | 6.7% | 6.8% | 6.8% |
| Corporation tax (excl North Sea) | 6.1% | 6.2% | 6.1% |
| National insurance contributions | 7.5% | 7.5% | 7.5% |
| Value added tax | 8.8% | 8.8% | 8.8% |
| Council tax and non-domestic rates | 7.8% | 8.0% | 7.9% |
| All other revenue | 8.7% | 8.7% | 8.6% |
| Total current non-North Sea revenue | 7.7% | 7.8% | 7.7% |
Estimated Revenue: Scotland and the UK, 2022-23 to 2024-25
Table 1.3 shows estimates of revenue per person for Scotland and the UK between 2022-23 and 2024-25. Revenue per person in Scotland is higher than in the UK by £91 in 2024-25, down from £333 higher in 2023-24. Excluding North Sea revenue, Scottish revenue is £578 lower.
Table 1.4 shows estimated revenue in Scotland and the UK between 2022-23 and 2024-25. Over this period, Non-North Sea revenue in Scotland is estimated to have grown by 10.1% in nominal terms, slightly slower than the UK as a whole (10.5%).
| Source of Revenue | 2022-23 | 2023-24 | 2024-25 |
|---|---|---|---|
| Scotland - Excluding North Sea | 14,530 | 15,475 | 15,736 |
| Scotland - Including North Sea (population) | 14,676 | 15,554 | 15,802 |
| Scotland - Including North Sea (geographical) | 15,975 | 16,360 | 16,471 |
| UK - Excluding North Sea | 15,111 | 15,948 | 16,314 |
| UK - Including North Sea | 15,257 | 16,027 | 16,380 |
| Difference (Scotland minus UK) - Excluding North Sea | -581 | -473 | -578 |
| Difference (Scotland minus UK) - Including North Sea (population) | -581 | -473 | -578 |
| Difference (Scotland minus UK) - Including North Sea (geographical) | 718 | 333 | 91 |
| Scotland | UK | |||||
|---|---|---|---|---|---|---|
| Source of Revenue | 2022-23 | 2023-24 | 2024-25 | 2022-23 | 2023-24 | 2024-25 |
| Income tax | 16,797 | 18,825 | 20,714 | 251,986 | 277,418 | 305,059 |
| National insurance contributions | 13,520 | 13,559 | 12,904 | 180,101 | 179,907 | 172,416 |
| Value added tax | 14,092 | 14,864 | 15,234 | 160,225 | 168,508 | 172,696 |
| Onshore Corporation tax | 4,560 | 5,691 | 5,855 | 75,256 | 91,948 | 95,726 |
| Fuel duties | 2,198 | 2,179 | 2,159 | 25,098 | 24,828 | 24,675 |
| Non-domestic rates | 2,792 | 3,033 | 3,263 | 28,978 | 29,637 | 31,854 |
| Council tax | 2,742 | 2,925 | 2,994 | 41,967 | 44,489 | 47,446 |
| VAT refunds | 2,291 | 2,504 | 2,626 | 25,097 | 27,955 | 29,344 |
| Capital gains tax | 591 | 506 | 456 | 16,929 | 14,494 | 13,063 |
| Inheritance tax | 386 | 409 | 450 | 7,121 | 7,535 | 8,286 |
| UK stamp duties | 210 | 179 | 240 | 19,132 | 16,792 | 20,602 |
| Land & buildings transaction tax | 838 | 777 | 923 | 838 | 777 | 923 |
| Scottish landfill tax | 110 | 69 | 53 | 110 | 69 | 53 |
| Air passenger duty | 252 | 291 | 294 | 3,268 | 3,884 | 4,195 |
| Tobacco duties | 961 | 915 | 808 | 9,375 | 8,969 | 7,908 |
| Alcohol duties | 1,126 | 1,137 | 1,143 | 12,384 | 12,515 | 12,575 |
| Insurance premium tax | 528 | 594 | 635 | 7,455 | 8,382 | 8,967 |
| Vehicle excise duties | 571 | 611 | 652 | 7,341 | 7,853 | 8,378 |
| Environmental levies | 817 | 922 | 937 | 7,200 | 8,080 | 8,212 |
| Other taxes | 2,973 | 2,829 | 2,787 | 37,642 | 35,437 | 35,607 |
| Total Non-North Sea taxes | 68,355 | 72,816 | 75,127 | 917,503 | 969,476 | 1,007,985 |
| North Sea (Population share) | 798 | 437 | 364 | 9,907 | 5,444 | 4,560 |
| North Sea (Geographical share) | 7,891 | 4,873 | 4,077 | 9,907 | 5,444 | 4,560 |
| Interest and dividends | 2,783 | 3,547 | 3,115 | 34,243 | 44,811 | 42,798 |
| Gross operating surplus | 7,984 | 8,559 | 8,874 | 70,388 | 75,810 | 79,241 |
| Other receipts | 178 | 224 | 184 | 1,911 | 2,394 | 1,955 |
| Total excluding North Sea | 79,299 | 85,146 | 87,300 | 1,024,045 | 1,092,491 | 1,131,979 |
| Total including population share of North Sea | 80,097 | 85,584 | 87,664 | 1,033,952 | 1,097,935 | 1,136,539 |
| Total including geographical share of North Sea | 87,190 | 90,019 | 91,376 | 1,033,952 | 1,097,935 | 1,136,539 |
| Of which, revenue accounting adjustment | 8,353 | 9,130 | 9,627 | 85,975 | 94,427 | 99,652 |
Comparison between GERS and ONS estimates
Any analysis of public sector receipts in Scotland relies on estimation, and as such alternative estimates are possible. As discussed in the Preface, GERS estimates revenue using a set of apportionment methodologies, refined over a number of years following consultation with, and feedback from, users.
The Office for National Statistics (ONS) publishes public sector finances for the countries and regions of the UK. The latest estimates covering the period to 2022-23 were published on 7 June 2024.[17] The ONS has not published estimates in 2025.
Table 1.5 below compares the estimates in GERS with those published by ONS. There are some differences between the ONS and GERS numbers. For non-North Sea taxes, these primarily relate to VAT. The estimates of VAT in GERS are consistent with those published by HMRC for Scottish Assigned VAT, whilst the ONS use a methodology which produces results for all UK country and regions. The ONS, HMRC and the devolved administrations are working together to reconcile, and where possible align, methodologies for estimating tax receipts for the UK countries and regions.
The differences in other non-North Sea receipts are primarily due to using different data sources for interest and dividends, where GERS uses specific data for interest income from Scottish student loans.
| Revenue Estimate | 2022-23 | 2023-24 | 2024-25 |
|---|---|---|---|
| Non-North Sea taxes - GERS | 68,355 | 72,816 | 75,127 |
| Non-North Sea taxes - ONS | 67,153 | n/a | n/a |
| Non-North Sea taxes - Difference | 1,202 | n/a | n/a |
| Other non-North Sea receipts - GERS | 10,944 | 12,330 | 12,173 |
| Other non-North Sea receipts - ONS | 11,682 | n/a | n/a |
| Other non-North Sea receipts - Difference | -738 | n/a | n/a |
| Geographical share of North Sea revenues - GERS | 7,891 | 4,873 | 4,077 |
| Geographical share of North Sea revenues - ONS | 7,944 | n/a | n/a |
| Geographical share of North Sea revenues - Difference | -53 | n/a | n/a |
Contact
Email: economic.statistics@gov.scot