Publication - Statistics
Government expenditure & revenue Scotland 2024-25
Government Expenditure and Revenue Scotland (GERS) is an Accredited Official Statistics publication. It estimates the revenue raised in Scotland and the cost of public services provided for Scotland.
Part of
Summary
Introduction
- Government Expenditure and Revenue Scotland (GERS) addresses three questions about Scotland’s public sector finances under the current constitutional arrangements:
- What revenues were raised in Scotland?
- How much was spent on public services for Scotland?
- To what extent did revenues cover the costs of these public services?
- GERS is not a measure of the Scottish Government’s fiscal position, rather it is a measure of Scotland’s overall fiscal position. Further information on Scottish Government and devolved finances is provided in the FAQs and Preface.
- GERS is an Accredited Official Statistics publication. It is assessed by the Office for Statistics Regulation (OSR), the regulatory arm of the UK Statistics Authority, to ensure that it meets the standards set out in the Code of Practice for Statistics.
- The tables below provide figures for the last three years. Figures for back to 1998-99 are available online in the accompanying spreadsheets.
- Feedback from users of the publication is welcome. Comments can be emailed to economic.statistics@gov.scot.
Scotland’s Overall Fiscal Position
- GERS provides two measures of Scotland’s fiscal position, the net fiscal balance and the current budget balance.
- The net fiscal balance measures the difference between total public sector expenditure and public sector revenue. It therefore includes public sector capital investment, such as the construction of roads, hospitals, and schools, which yields benefits not just to current taxpayers but also to future taxpayers. It is shown in Table S.1 below.
- The results for this year’s publication show overall public finances in Scotland weakening, as expenditure grew faster than revenue. Revenues from the North Sea and the Energy Profits Levy fell in 2024-25 for the second year as energy prices continued to fall back from the highs seen in 2022 and 2023. Compared to the UK, weaker revenue growth also reflected weaker growth in interest income from student loans and the impact of the Council Tax freeze.
- On the spending side, falling inflation saw spending on reserved debt interest payments, partly linked to inflation, fall back slightly, although it remains higher than pre-pandemic. Growth in spending on social protection grew strongly and has grown faster in Scotland than the UK in 2024-25. This will in part reflect spending associated with devolved social security programmes.
| Statistic | 2022-23 | 2023-24 | 2024-25 |
|---|---|---|---|
| Scotland (£ million) | -19,010 | -21,407 | -26,188 |
| Scotland - excluding North Sea (£ million) | -26,901 | -26,280 | -30,265 |
| Scotland (% of GDP) | -8.7% | -9.7% | -11.6% |
| Scotland - excluding North Sea (% of GDP) | -13.9% | -12.9% | -14.3% |
| UK (% of GDP) | -4.9% | -4.8% | -5.1% |
- In 2024-25, Scotland’s net fiscal balance as a share of GDP was -11.6%, compared to -9.7% in 2023-24. This is a deterioration of 1.9 percentage points for Scotland, whilst the UK deficit deteriorated by 0.4 percentage points. This partly reflects a fall in North Sea revenue, with Scottish North Sea revenue falling by £0.8 billion in 2024-25 to £4.1 billion.
- However, the difference is primarily explained by movements in non-North Sea revenue and spending, with Scottish revenue growing more slowly and Scottish expenditure growing more quickly than the UK. Excluding North Sea revenue, the net fiscal balance for Scotland worsened by 1.3 percentage points.
- The current budget balance shows the difference between revenue and current expenditure only. It therefore excludes public sector capital investment. It measures the degree to which taxpayers meet the cost of paying for public services, excluding capital investment. It is shown in Table S.2 below.
- The current budget balance for Scotland tends to move in line with the net fiscal balance figure but is typically around 2 to 3 percentage points smaller as a share of GDP. However, the gap between the current budget balance and the net fiscal balance increased in 2024-25, as capital spending grew strongly, particularly with increased reserved capital spending on defence. In 2024-25, the deficit on the Scottish current budget balance increased by 1.0 percentage points.
| Statistic | 2022-23 | 2023-24 | 2024-25 |
|---|---|---|---|
| Scotland (£ million) | -13,745 | -15,978 | -18,708 |
| Scotland - excluding North Sea (£ million) | -21,636 | -20,851 | -22,784 |
| Scotland (% of GDP) | -6.3% | -7.3% | -8.3% |
| Scotland - excluding North Sea (% of GDP) | -11.2% | -10.2% | -10.7% |
| UK (% of GDP) | -3.1% | -2.3% | -2.5% |
Scotland’s revenue
- Table S.3 shows two measures of Scotland’s public sector revenue: (i) all Scottish revenue, and (ii) excluding North Sea revenue.
- Scotland’s revenue in 2024-25 grew by £1.4 billion to £91.4 billion. This was an increase of 1.5% from 2023-24. This reflects growth in onshore receipts being partially offset by falling oil and gas revenue. Scottish revenue was 8.0% of the UK total, the same as its population share.
- Scotland’s share of UK non-North Sea revenue was 7.7% in 2024-25, slightly lower than in 2023-24 but the same as 2022-23. Onshore revenue grew by 2.5%, with strong growth in income tax and inheritance tax, which both grew by 10%, offset by falling receipts from National Insurance Contributions, fuel duties, and interest and dividends.
- The growth in income tax and inheritance tax reflects the impact of inflation contributing to high nominal earnings growth and increases in asset values. Falling receipts from National Insurance Contributions reflects reductions in the rate paid by employees. Fuel duties declined slightly, reflecting the trend toward electric and hybrid vehicles. The decline in interest and dividends reflects reductions in the interest rate applied on Scottish student loans.
| Statistic | 2022-23 | 2023-24 | 2024-25 |
|---|---|---|---|
| Scotland (£ million) | 87,190 | 90,019 | 91,376 |
| Scotland - excluding North Sea (£ million) | 79,299 | 85,146 | 87,300 |
| Scotland (% of UK revenue ) | 8.4% | 8.2% | 8.0% |
| Scotland - excluding North Sea (% of UK revenue) | 7.7% | 7.8% | 7.7% |
| Scotland (% of GDP ) | 39.8% | 40.9% | 40.4% |
| Scotland - excluding North Sea (% of GDP) | 41.1% | 41.8% | 41.1% |
| UK (% of GDP) | 40.0% | 40.0% | 39.3% |
- Table S.4 below shows estimates of revenue per person for Scotland and the UK. In the latest year, revenue per person was £91 higher than the UK average. The difference between revenue per person in Scotland and the UK is variable and depends largely on North Sea revenue. In 2022-23, when North Sea revenue was higher, revenue per person was £718 higher than the UK average.
- Excluding North Sea revenue, revenue per person in Scotland was lower than the UK average by £578 in 2024-25.
| Statistic | 2022-23 | 2023-24 | 2024-25 |
|---|---|---|---|
| Scotland | 15,975 | 16,360 | 16,471 |
| Scotland - excluding North Sea | 14,530 | 15,475 | 15,736 |
| UK | 15,257 | 16,027 | 16,380 |
| UK - excluding North Sea | 15,111 | 15,948 | 16,314 |
| Difference Scotland minus UK - Including North Sea | 718 | 333 | 91 |
| Difference Scotland minus UK - excluding North Sea | -581 | -473 | -578 |
Scotland’s spending
- Table S.5 below shows estimates of public spending for Scotland. Expenditure increased to £117.6 billion in 2024-25, from £111.4 billion in 2023-24. As a share of GDP, public spending remained at historically high levels in 2024-25, at 52% of GDP, over 5 percentage points higher than prior to the pandemic.
- Overall, spending in 2024-25 grew slightly faster than the onshore economy. Spending as a share of onshore GDP increased to 55.4%.
- Within overall spending, 2024-25 saw particularly strong growth in social protection and spending. Growth in spending on social protection grew faster in Scotland than the UK in 2024-25. This will in part reflect spending associated with devolved social security programmes.
- In contrast, there were falls in spending associated with reserved public sector debt interest as inflation fell back from the highs seen during 2022-23, and spending associated with the EU Withdrawal Agreement.
| Statistic | 2022-23 | 2023-24 | 2024-25 |
|---|---|---|---|
| Scotland (£ million) | 106,200 | 111,426 | 117,564 |
| Scotland (% of UK Expenditure) | 9.1% | 9.1% | 9.1% |
| Scotland (% of GDP) | 48.5% | 50.6% | 52.0% |
| Scotland - excluding North Sea (% of GDP) | 55.1% | 54.8% | 55.4% |
| UK (% of UK GDP) | 44.9% | 44.7% | 44.4% |
Table S.6 below shows estimates of expenditure per person for Scotland and the UK. Expenditure for Scotland has been consistently higher per person than the UK average over the period.
| Statistic | 2022-23 | 2023-24 | 2024-25 |
|---|---|---|---|
| Scotland | 19,459 | 20,251 | 21,192 |
| UK | 17,132 | 17,940 | 18,523 |
| Difference Scotland minus UK | 2,327 | 2,311 | 2,669 |
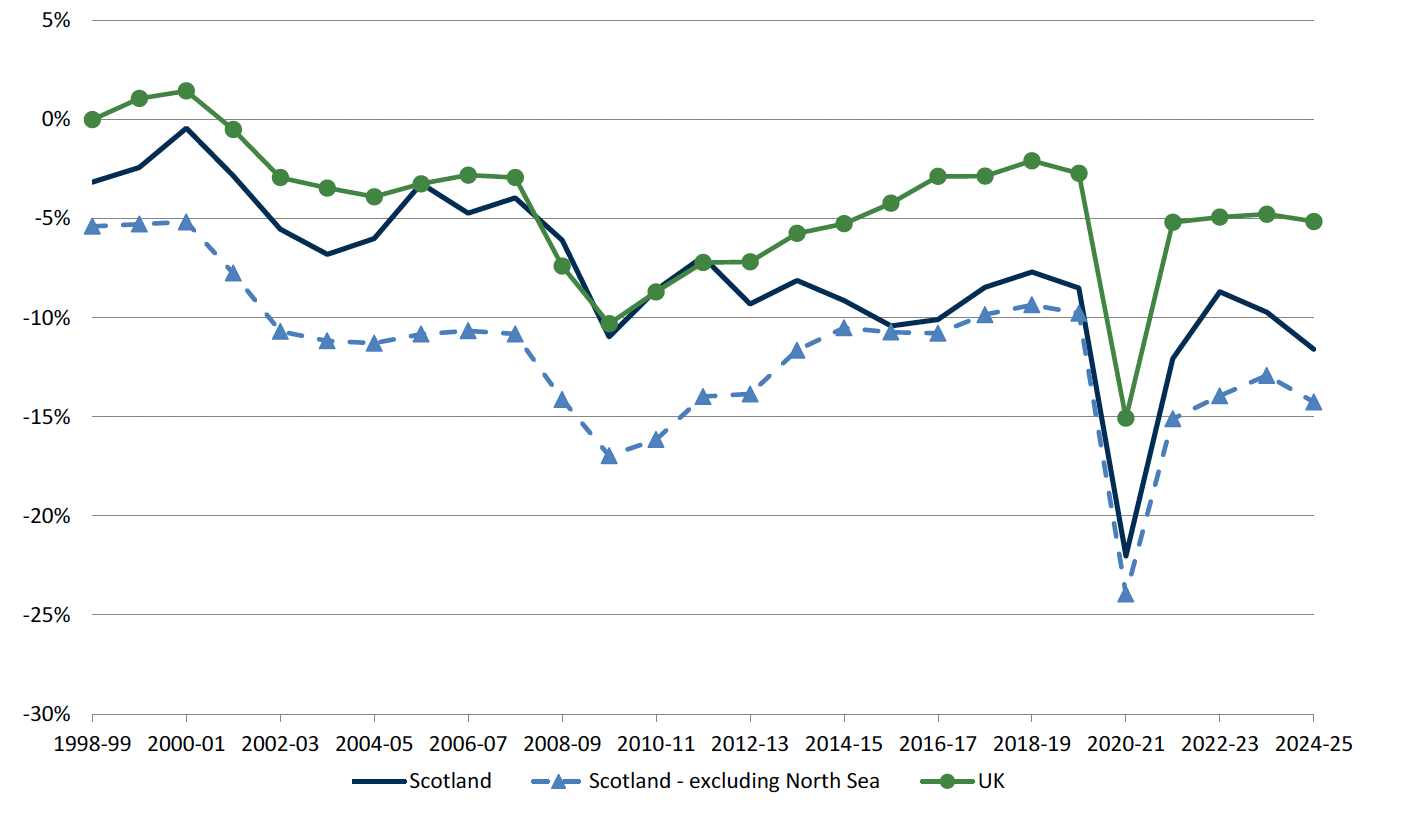
Annual Net Fiscal Balance, 1998-99 to 2024-25, Percentage of GDP
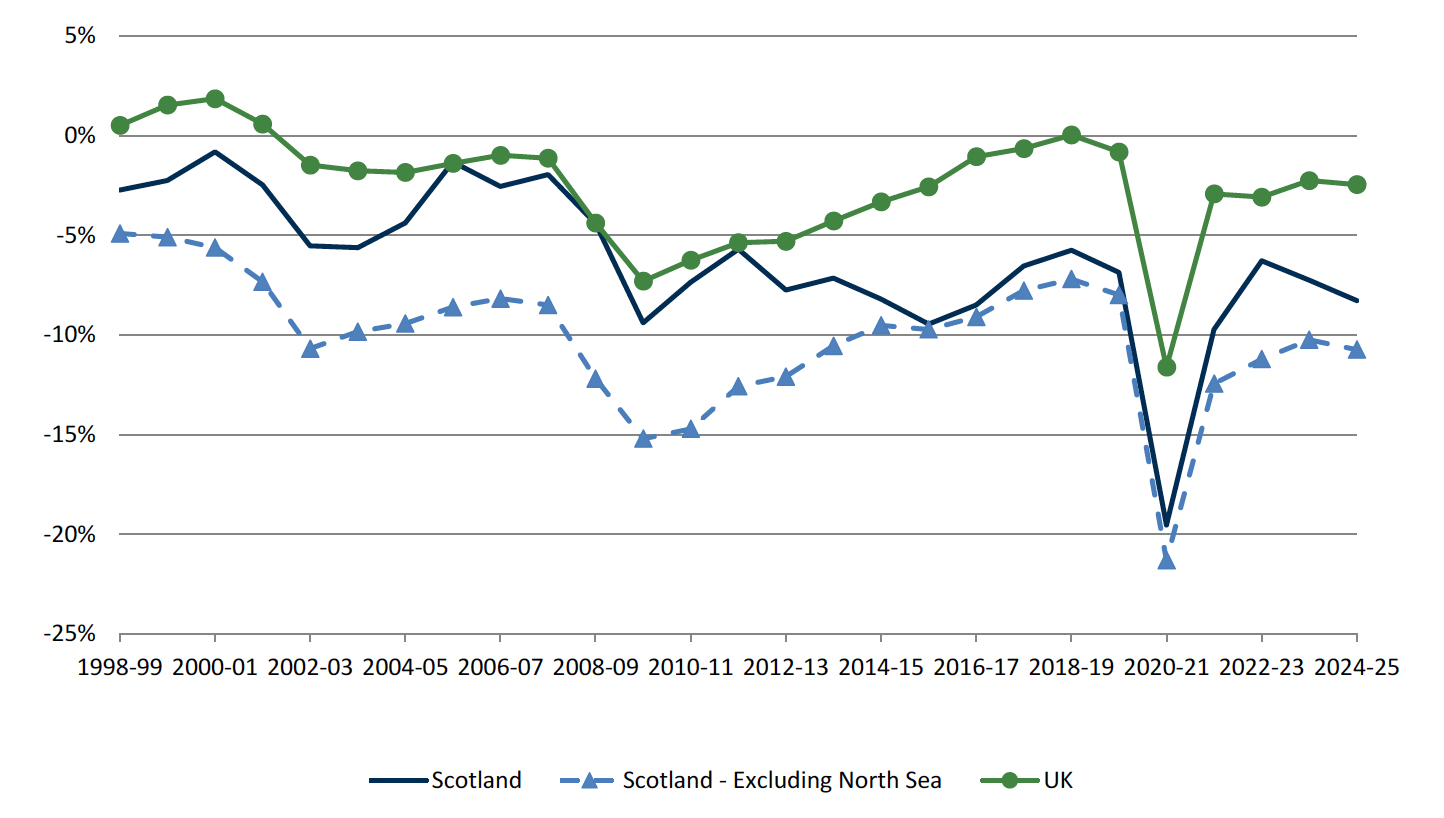
Annual Budget Balance , 1998-99 to 2024-25, Percentage of GDP
Contact
Email: economic.statistics@gov.scot