Local Government Candidates Survey 2022
A voluntary demographic survey of candidates running in the Scottish Local Government elections of 2022
8. Religion
Candidates were asked to indicate which if any religion, religious denomination or body they belonged to with responses indicating that the largest group were those of no religion (48%), followed by various Christian affiliated beliefs, including followers of the Church of Scotland at 20% and Roman Catholics at 12% and Other Christians at 11%. Muslim respondents made up 2% while those belonging to another religion other than Christianity and Islam totalled 4% and those who preferred not to say made up 3% of respondents.
| Religion or belief |
% of Respondents |
|---|---|
| None |
48% |
| Church of Scotland |
20% |
| Roman Catholic |
12% |
| Other Christian |
11% |
| Another Religion |
4% |
| Prefer not to say |
3% |
| Muslim |
2% |
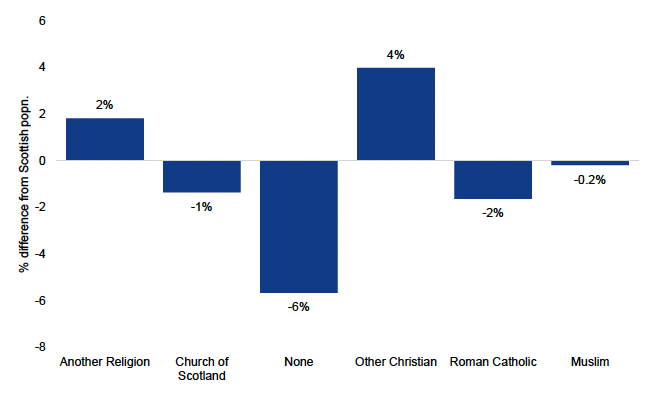
Again by comparing the results of the survey with data from the SSCQ, detailed in figure 11 below, we can see that those of no religion were the largest group underrepresented amongst respondents at 6 percentage point variance. Those of an Other Christian group affiliation were the most over represented at 4% variance.
With regards to electoral outcome, figure 12 sets out the proportions of elected candidates and unelected candidates by which religious group they identify with.
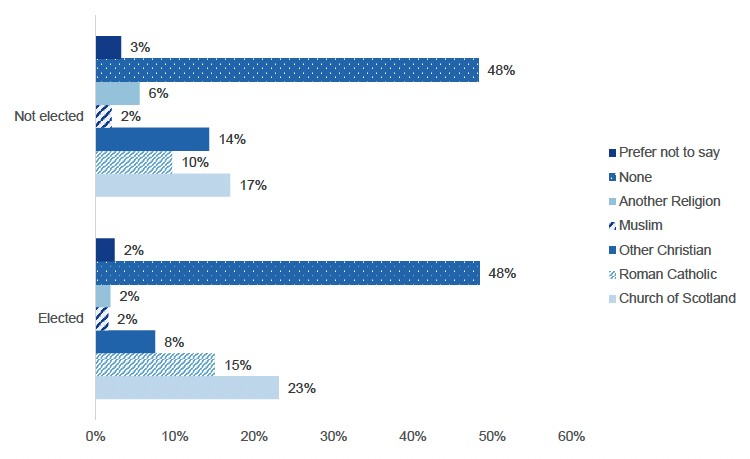
This data indicates that those of no religion made up the largest group of both elected (48%) and non-elected (48%) respondents, followed by members of the Church of Scotland who represented 23% of all elected respondents and 17% of unelected respondents. Those of a religion other than Christianity made up approximately 3.5% of the elected group.
Contact
Email: Arfan.Iqbal@Gov.Scot