Local Government Candidates Survey 2022
A voluntary demographic survey of candidates running in the Scottish Local Government elections of 2022
15. Caring Responsibilities
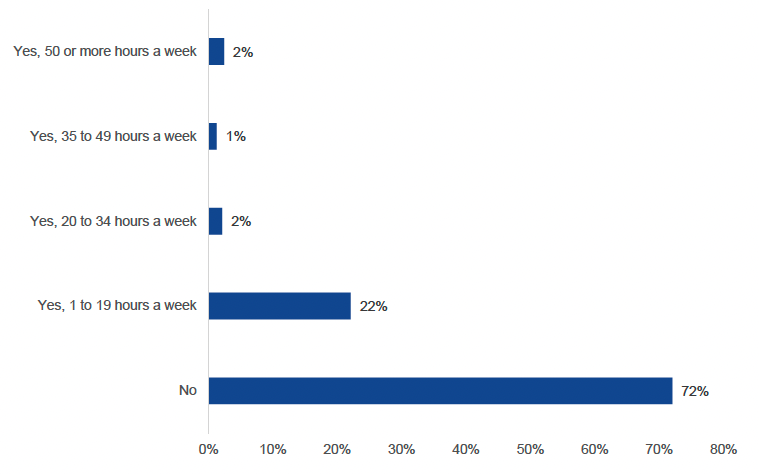
Candidates were asked whether they provided care to support family members, friends, neighbours or others due to health conditions, disabilities or old age.
In total 28% of respondents provided care of some sort, with a further breakdown provided in figure 28 below. We can see from the chart that the largest group were individuals who provided care between 1 and 19 hours per week, representing 22% of the entire respondent group.
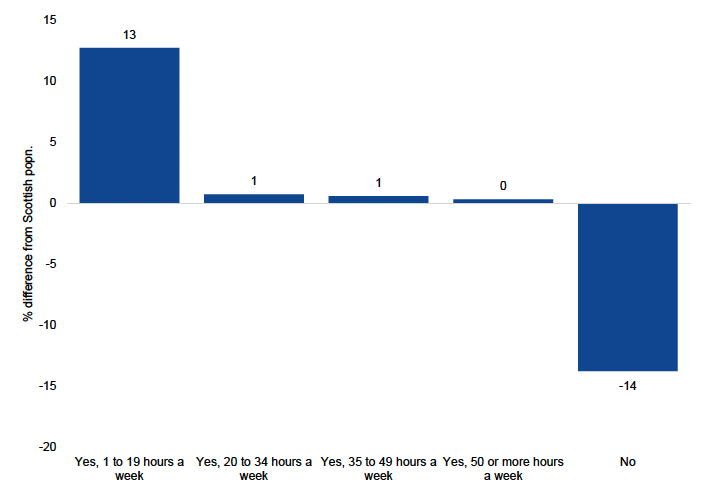
By comparing to data from the 2019 Scottish Health Survey, we find that the proportion of individuals providing care within the Diversity Survey was much larger (Figure 29). This amounted to an overall difference of 14 percentage points. In particular there were a much larger percentage of respondents who reported providing care of between 1 and 19 hours per week (22%) as compared to the overall population (9%). Differences between the respondent group and the overall population were less striking or almost absent for hours of care provided above this number.
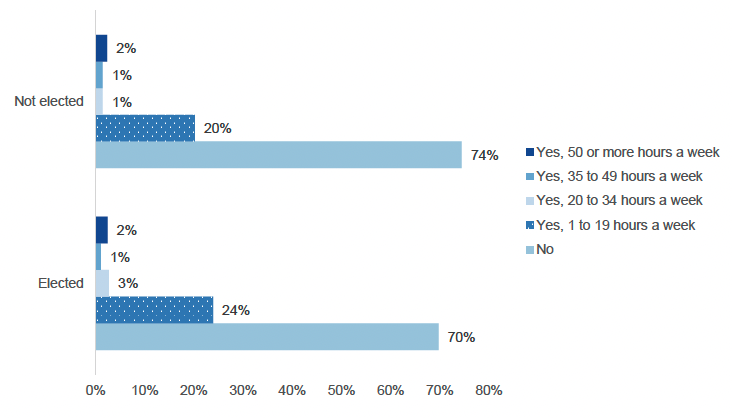
With regards to elected respondents, we can see that 30% of the elected cohort provided care of some sort, whereas this figure was only 26% for those who were not successfully elected (Figure 30).
Contact
Email: Arfan.Iqbal@Gov.Scot