Local Government Candidates Survey 2022
A voluntary demographic survey of candidates running in the Scottish Local Government elections of 2022
10. Education and Qualifications
Candidates were asked to state the highest level of educational qualification they had achieved, selecting from a pre-defined list which adheres to the Scottish Vocational Qualification descriptors[9]. Analysis was then undertaken to identify the distribution of qualifications which is presented below in figure 16.
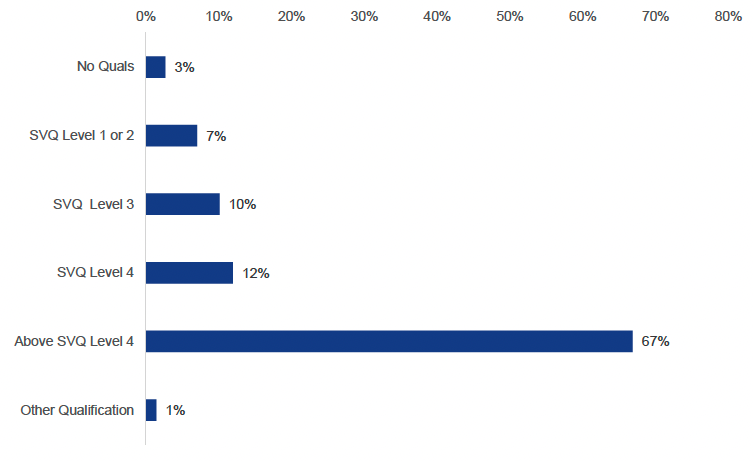
As we can see from the above, the majority of respondents (67%) had a qualification above SVQ level 4 which is equivalent to a degree level or above qualification and only 3% of respondents having no qualifications at all.
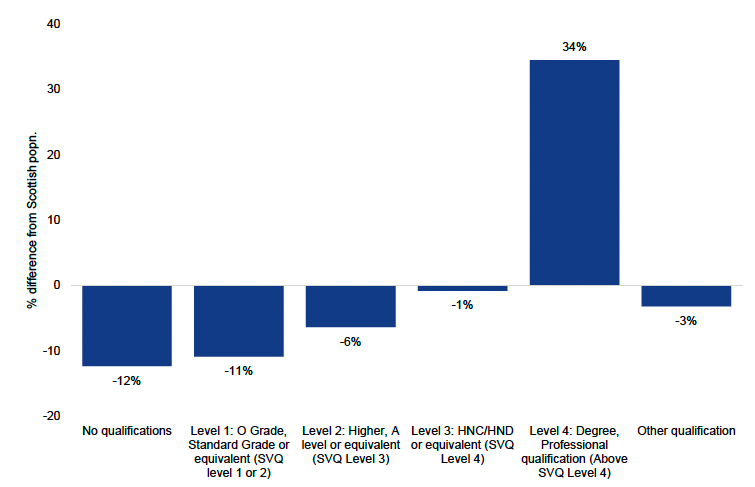
Comparing this to the Scottish population as in figure 17 we can see that there were a far greater number of respondents with degree level qualifications compared to the Scottish population in total (34% percentage point difference) and far lower numbers with lower level qualifications or no qualifications at all.
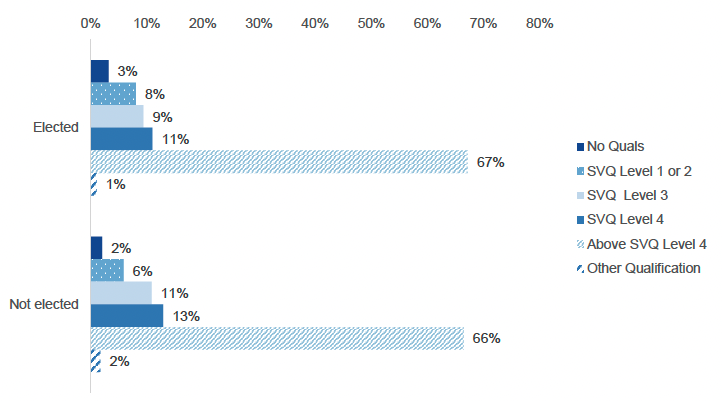
Nonetheless there did not appear to be a notable difference in the qualification distributions of those candidates who were successfully elected and those who were not, with only minor differences in the educational profile of both groups as set out in figure 18 above.
Contact
Email: Arfan.Iqbal@Gov.Scot