Local Government Candidates Survey 2022
A voluntary demographic survey of candidates running in the Scottish Local Government elections of 2022
12. Socio-Economic Category
In order to obtain a measure of candidates socio-economic backgrounds respondents were asked to identify the occupation of their main household earner when they were aged 14 years of age.
This question is asked in line with advice published by the UK Government's Social Mobility Commission as a valid and robust way to determine the socio-economic background of individuals[11].
The results suggest the majority of respondents came from higher socio-economic backgrounds, with parents in a professional form of employment making up 64% of all respondents, those from an intermediate background making up 17% of respondents, 11% coming from a working class or lower socio-economic background, and 8% coming from another background (including with parents who were retired).
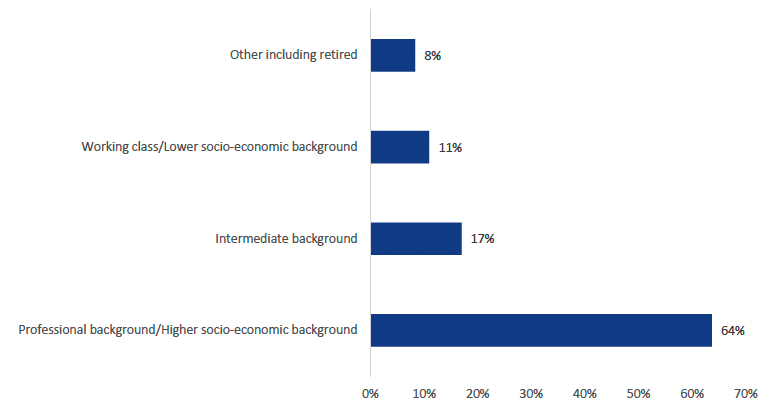
Unfortunately Scotland level data is not available to compare these figures to however data available at the UK level suggests that of the overall UK workforce aged 16 and above in May 2021, 37% had parents from a professional background, 24% from an intermediate background, and 39% from a working class background. Overall this suggests that amongst candidates who responded to the survey there was a notably higher proportion of individuals from more advantaged socio-economic backgrounds as compared to the population at a UK level.
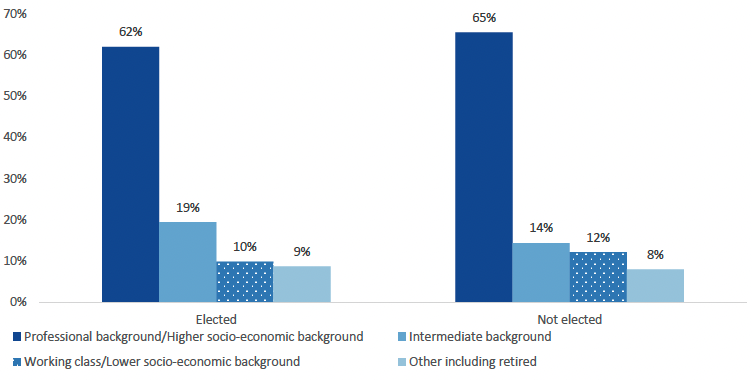
When comparing the profile of elected and unelected candidates we see that 62% of elected candidates were from a professional or higher socio-economic background, 19% from an intermediate background, and 10% from a working class background (Figure 23). These findings were broadly similar for unelected candidates however with a slightly higher percentage of working class individuals (12%) amongst the unelected group, and a lower percentage of intermediate background individuals (19%).
Contact
Email: Arfan.Iqbal@Gov.Scot