Local Government Candidates Survey 2022
A voluntary demographic survey of candidates running in the Scottish Local Government elections of 2022
17. Intersectionality
A stated goal of this project was to consider the issue of intersectionality in relation to the profile of candidates who stand for election at a Local Government level. Intersectionality has been defined by the Equality and Human Rights Commission as the combination of multiple specific demographic characteristics, which when combined can result in distinct forms of disadvantage or discrimination[15].
Due to constraints resulting from sample sizes we have opted to restrict our intersectional analysis here to only combinations of age and sex as one category, and sex and disability as a second discrete category.
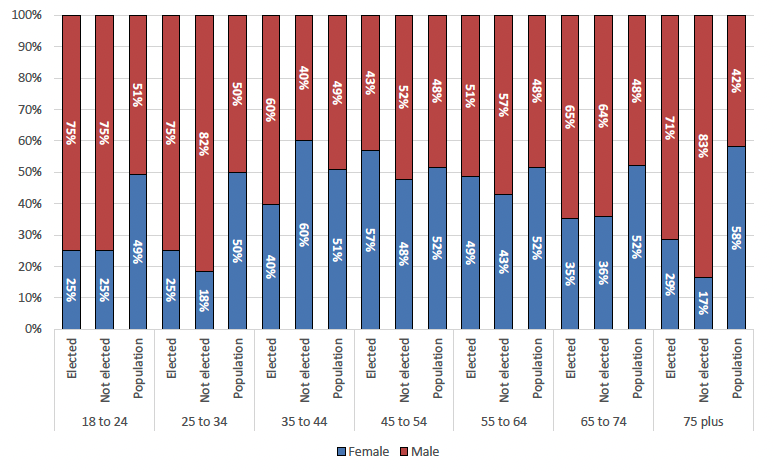
With regards to age and sex, we can see in the figure 33 below a breakdown of how age and sex combine in relation to both electoral outcomes for candidates, compared to the overall population matched by age and sex.
The data suggests several important findings. Firstly we can see that amongst 18 to 24 year olds that a significantly higher proportion of males both stood for election overall, were elected (75%) or unelected (75%) as compared to the overall population for that age group (51% being male). This pattern also persists for those aged 25 to 34 but is less prominent for older age groups until we get to those aged 65 or above, where again this discrepancy reasserts itself. For age groups between 35 and 64 there is much less of a notable difference between males and females, both with regards to those who were successful at election and those that were unsuccessful, as compared to the overall population. This suggests that the gender imbalance is particularly acute at the younger and older age ranges amongst respondents.
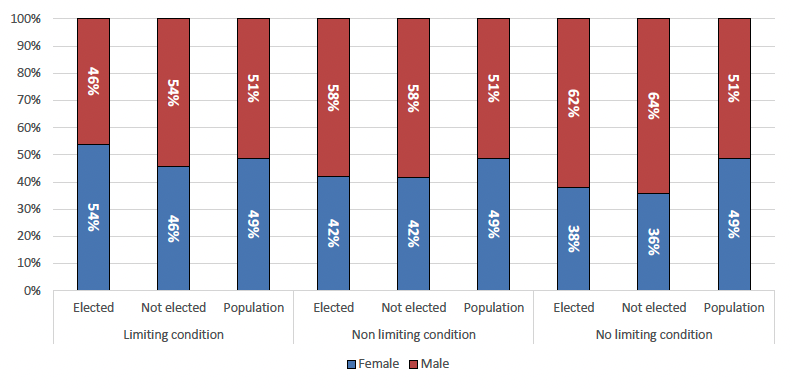
With regards to the interactions between sex and disability status the data suggests that females made up a higher percentage of elected candidate respondents with a limiting condition (54%), as compared to both the non-elected group (46%) and the overall population (49%). This was the inverse when it came to non-limiting conditions with elected males (58%) and unelected males (58%) making up the majority at a higher rate than the overall population of this group (49%). Similarly amongst those with no limiting conditions there were more males both elected (62%), and unelected (64%) compared to the overall population (51%).
These results suggest that there is a greater prevalence of limiting conditions amongst successful female respondents in particular as compared to males and the overall population.
Contact
Email: Arfan.Iqbal@Gov.Scot