Local Government Candidates Survey 2022
A voluntary demographic survey of candidates running in the Scottish Local Government elections of 2022
11. Employment status
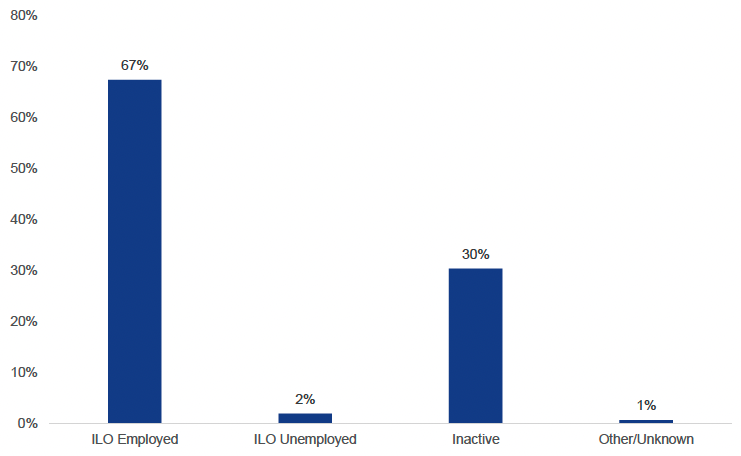
Candidates were asked to describe their current employment situation apart from or in addition to any work they may currently do as a councillor. These results were then aggregated into three categories following conventions set by the International Labour Organisation[10], namely ILO employed, unemployed and inactive.
The results in figure 19 below suggest that the majority of respondents (66%) were employed at the time of the survey in some form of work (separate to being a councillor), with 33% inactive (reasons for inactivity include being retired, a student, full-time carers amongst others) and the remainder (approximately 1%) were unemployed, other or unknown.
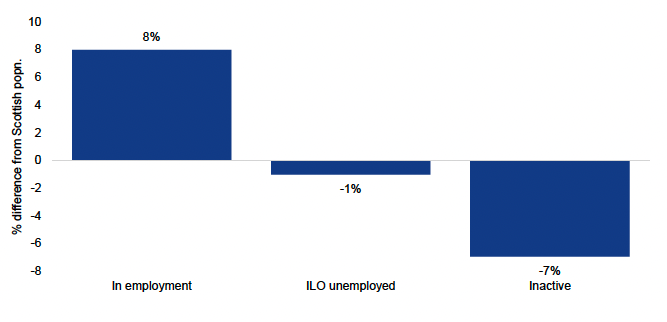
Compared to the population as a whole, the survey respondents were less likely to be inactive (by 7 percentage points) or unemployed (by 1 percentage point) and more likely to be in employment (8 percentage points) (Figure 20).
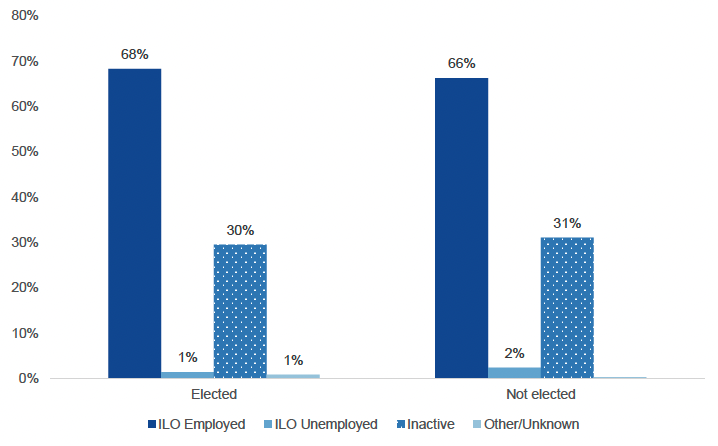
Comparing the employment profiles of successfully elected candidates as a group versus those who were not elected suggests that there is not a significant difference, with approximately similar numbers being employed, inactive or unemployed between both groups (Figure 21).
Contact
Email: Arfan.Iqbal@Gov.Scot