Local Government Candidates Survey 2022
A voluntary demographic survey of candidates running in the Scottish Local Government elections of 2022
7. Ethnicity
Candidates were asked to identify their ethnicity, with the aggregated results detailed below in table 4.
| Ethnicity |
% of Respondents |
|---|---|
| White: Scottish |
67.8% |
| White: Other British |
17.5% |
| White: Other |
6.6% |
| Asian |
1.9% |
| All other ethnic groups |
4.9% |
| Prefer not to say |
1.3% |
*White: Other includes those identifying as White: Polish due to concerns around disclosure control
The largest group were those identifying as White Scottish at 68%, with those identifying with any white group (including Other British, Polish and Other) totalling 92% of respondents overall.
A comparison of the respondents ethnic identification to the overall population has been made using data from the Scottish Surveys Core Questions dataset[8], the results of which can be found in figure 9 below.
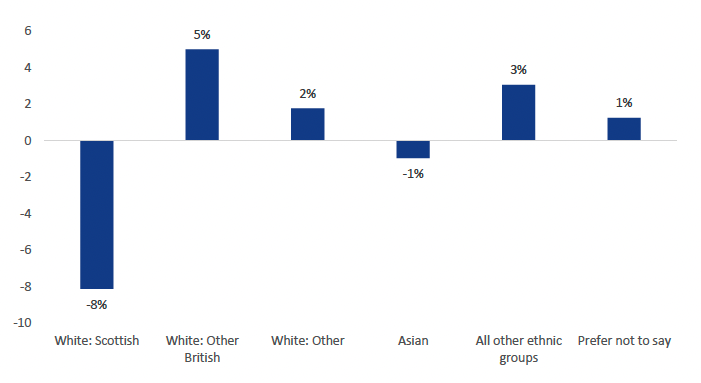
The results of this comparison suggest some variance between the respondent group of candidates and the overall population, notably with White Scottish and Asians being underrepresented, whilst White Other British, White Other, and All Other Ethnic Groups being overrepresented.
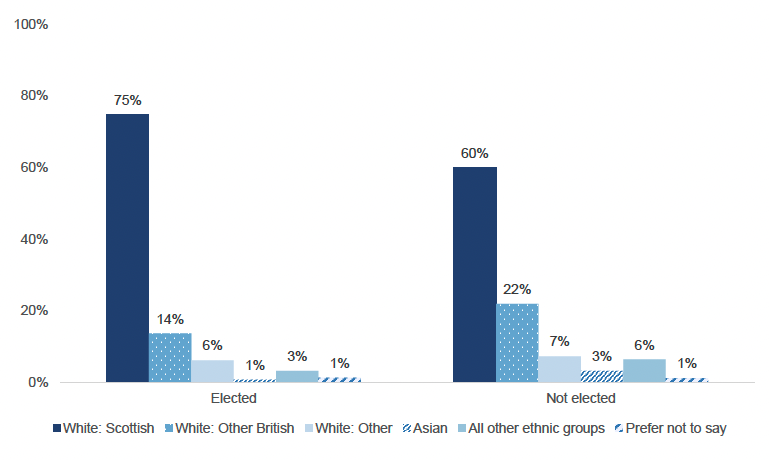
With regards to electoral outcome figure 10 highlights the proportions of each ethnic group by whether they were elected or unelected. The data demonstrates that individuals who identify as white Scottish made up 75% of successfully elected candidates. Non-white individuals made up 4% of elected candidates and 9% of unelected candidates
Contact
Email: Arfan.Iqbal@Gov.Scot