Local Government Candidates Survey 2022
A voluntary demographic survey of candidates running in the Scottish Local Government elections of 2022
13. Disability
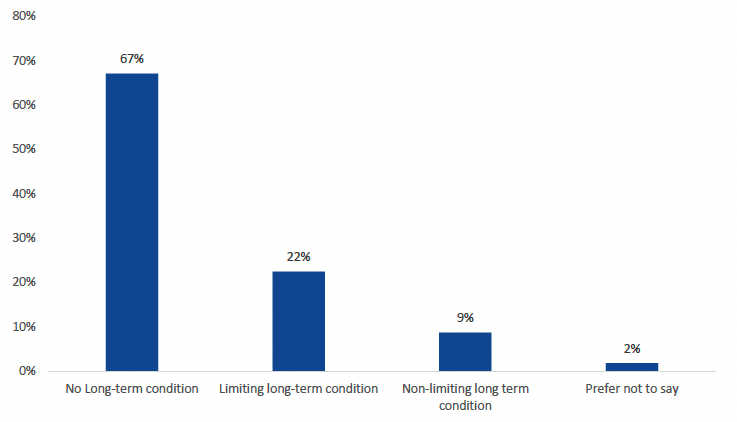
Candidates were asked a set of questions regarding their health in order to determine the proportions who live with a disability. Candidates were firstly asked whether they had a physical or mental health condition or illness that was expected to last twelve months or more, and if they answered yes were asked whether their condition or illness limited their ability to carry out day-to-day activities. The combined responses to both of these questions provides a measure of the proportion of individuals living with a limiting condition and is in keeping with the Equalities Act definitions[12]
The data in figure 24 below indicates that 67% of respondents did not have a limiting condition, 22% did have a limiting condition, 9% had a non-limiting condition and 2% preferred not to answer.
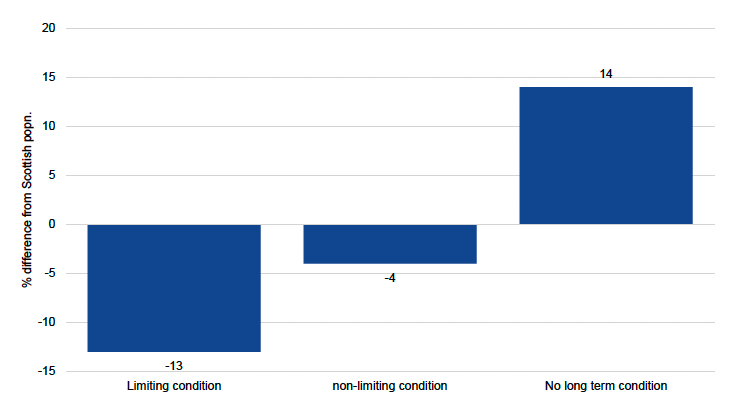
Comparing this to national data obtained from the Scottish Health Survey[13] 2019 we can see that there was a lower proportion of people with a limiting condition amongst survey respondents as compared to the overall Scottish population, with the difference amounting to 13 percentage points (Figure 25). To a lesser degree there was also a lower percentage of individuals with a non-limiting compared to the population, with the difference amounting to 4 percentage points.
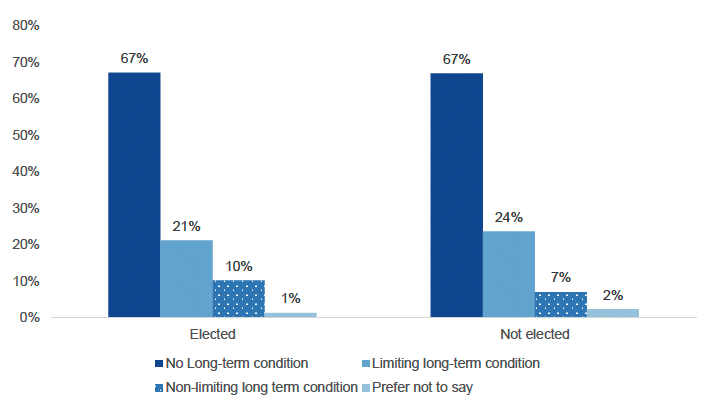
When analysing electoral outcome by disability status we see that there was a relatively even split in the proportions of individuals with no limiting condition who were either elected or not elected. However there was a slightly larger percentage of elected individuals with a non-limiting condition (10%) as opposed to amongst those who were not elected (8%), and similarly a lower percentage of those with a limiting condition elected (21% of those elected overall) compared to those not elected (24%).
Contact
Email: Arfan.Iqbal@Gov.Scot