Local Government Candidates Survey 2022
A voluntary demographic survey of candidates running in the Scottish Local Government elections of 2022
5. Sex
Candidates were asked what their sex was. As can be seen in figure 4 below, 58% identified as male, 40% as female and 2% preferred not to answer.
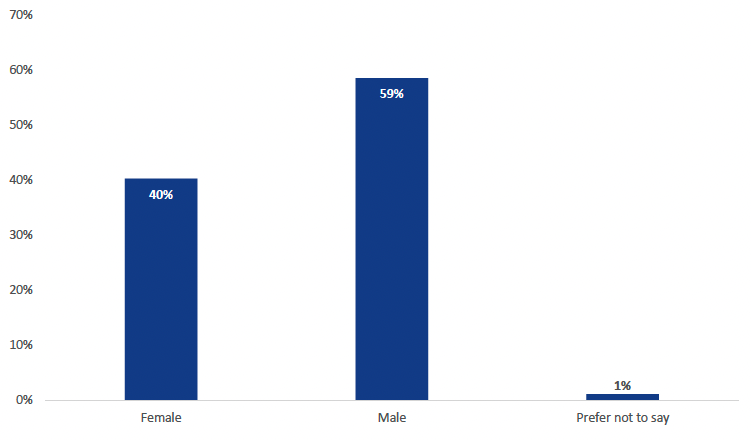
Comparing these results to National Records of Scotland data for the entire Scottish population[7] (52% of the population being female and 48% male), we can see that males are overrepresented amongst respondents with females being underrepresented as compared to the population of the country overall.
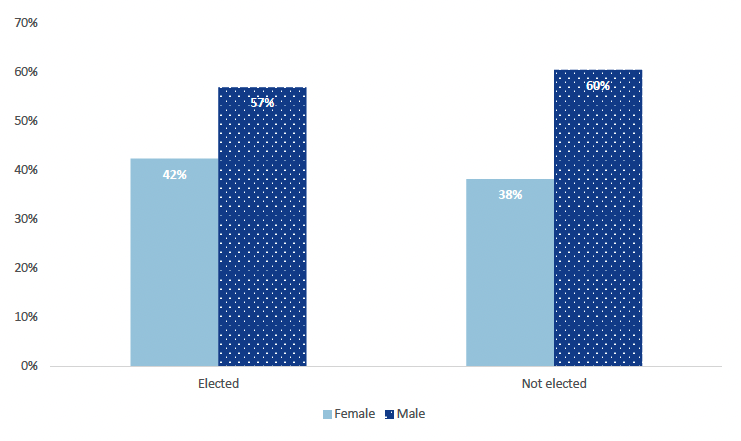
We can see in figure 5 above, that of the successfully elected candidates who responded to this survey 57% were male and 42% were female. For unelected respondents the split was 60% male and 38% female, with the remainder preferring not to say.
Contact
Email: Arfan.Iqbal@Gov.Scot