Estimation of sectoral CAP payment 'envelopes' 2019
This report uses data on the level of past funding provided to individual farm businesses and Standard Output (SO) values to estimate notional payment ‘envelopes’ to different sectors.
Relative sectoral support per unit of Standard output
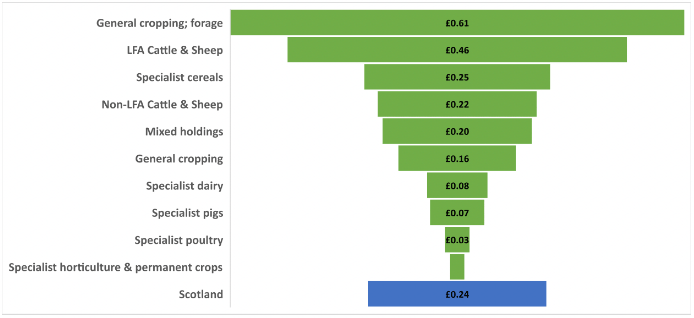
18. Following Thomson and Moxey (2020) it was possible to examine the relative levels of support within and between sectors and geographies using support per unit of SO. Total 'direct' support (2019) per £1 of standard output[14] (including unsupported activities) is shown for robust farm types in Figure 10. Across Scotland £0.24 of direct support was received per £1 of SO in 2019.[15] The figures illustrate wide ranging levels of average support between sectors with the specialist horticulture (£0.02), poultry (£0.03) and pigs (£0.07) in receipt of the lowest relative levels of support (as would be expected from area-based support on intensively farmed sectors). Specialist dairy farms (£0.08) also receive relatively low levels of direct support per unit of SO – at least half of other sectors. In contrast LFA cattle and sheep businesses received £0.46 per unit of SO and specialist forage farms £0.61 per unit of SO (reflecting limited grazing animals during the JAC period).
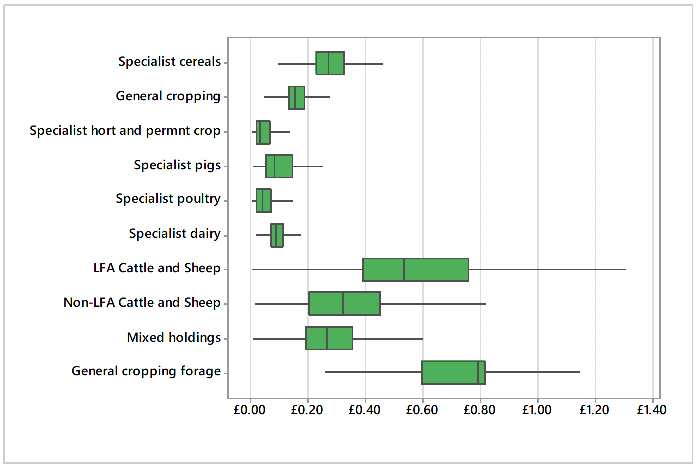
19. Figure 11 highlights the variation in relative support levels amongst businesses with the same robust farm type classification in 2019. Where payments are primarily reliant on area-based support (BPS and Greening) there is more limited variance in the distribution of relative support levels. In contrast, in the cattle and sheep sectors, where voluntary coupled support payments are an important component of the overall support there is considerably more variation in the relative levels of support per unit of SO.
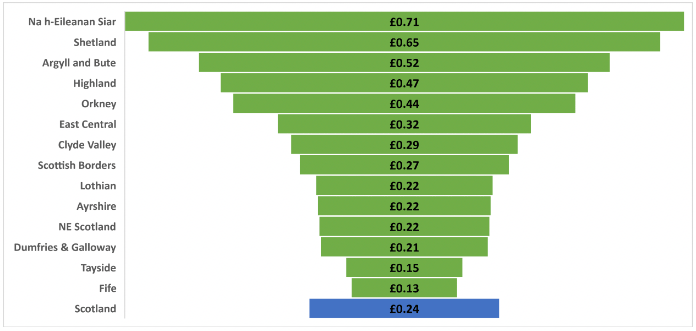
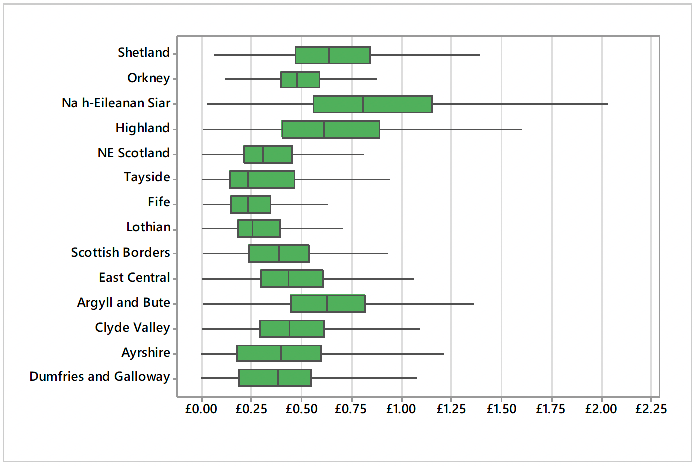
20. Average total 'direct' support (2019) per £1 of standard output (including unsupported activities) is shown for agricultural regions in Figure 12. Na h-Eileanan Siar received £0.71 of direct support per unit of SO, with Shetland receiving £0.65, Argyll and Bute £0.52 and Highland £0.47. These relatively high support levels reflect the high proportion of poor-quality land, low stocking densities and therefore low SO per hectare (the basis for most support). In contrast, businesses across Fife and Tayside only received £0.13 and £0.15 per £1 of SO respectively (with high proportion of horticulture and cropping output) followed by Dumfries and Galloway and North East Scotland, each receiving £0.22 per unit of output (reflecting the mix of dairy, cropping and intensive beef production).
21. Figure 13 highlights the variation in relative support levels amongst businesses within agricultural regions in 2019. This reiterates that there is less variation in the distributions in the more intensive cropping regions, and areas with higher proportions of rough grazing tend to have higher relative support variability that likely reflects the differences between Region 2 and Region3 BPS and Greening as well as LFASS gazing categories, etc (each a relic of historic stocking densities).
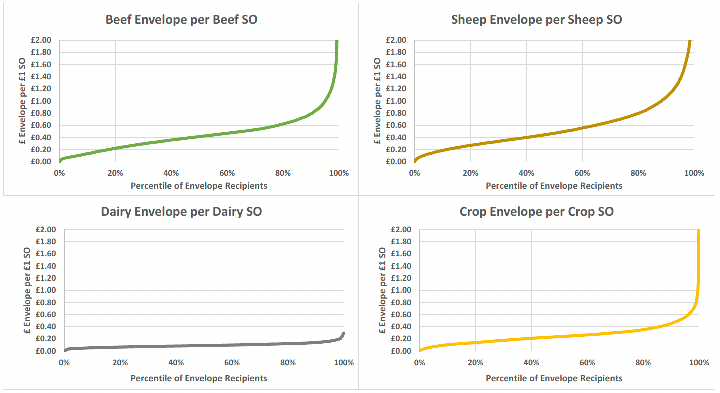
22. Figure 14 highlights the variation in the relative support levels within each of the sectoral envelopes. Whilst the relative support levels allocated across the dairy envelope were relatively similar this reflects that that "dairy" SO excludes any smaller dairy herds, and the nature of the sector. For all other sectoral envelopes there is a tail at the end where a small proportion of businesses were allocated relatively large payments in comparison to others in within that sector (being most pronounced in the sheep envelope).