Estimation of sectoral CAP payment 'envelopes' 2019
This report uses data on the level of past funding provided to individual farm businesses and Standard Output (SO) values to estimate notional payment ‘envelopes’ to different sectors.
Distribution of sectoral envelopes
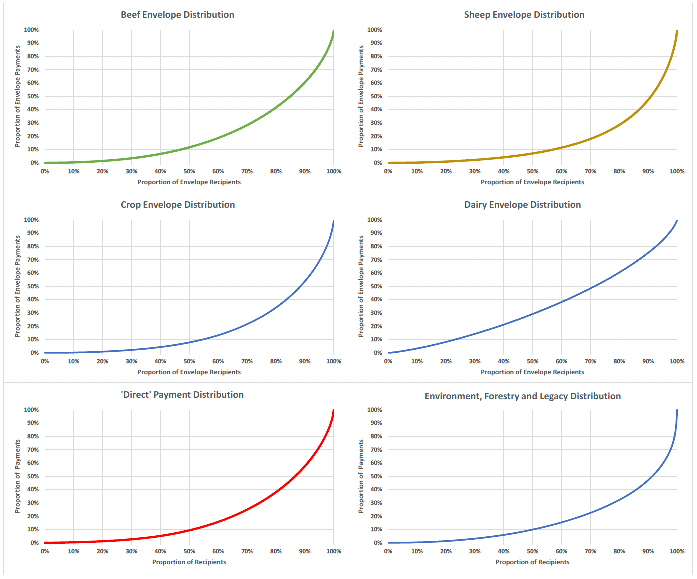
13. There was significant variation in the amounts distributed through the payment envelopes, reflecting the levels of activities and overall payments that a business receives. Figure 5 reveals that:
- Of the 9,676 businesses that were allocated beef envelope support, the top 5% of recipients accounted for 26% of the total envelope, with the top 10% allocated 39% and the top 15% some 50% of the envelope.
- Of the 10,123 businesses that were allocated sheep envelope payments the top 5% of recipients accounted for 37% of the total envelope, with 53% allocated to the top 10% of recipients and 77% of the envelope allocated to the top 25% of recipients.
- Of the 6,876 crop envelope recipients the top 20% were allocated 66% of the envelope, with the top 10% allocated 46% of the envelope and the top 5% recipients some 31% of the envelope.
- Of the 810 dairy envelope recipients the top 10% of businesses were allocated 25% of the envelope, with 54% allocated to the top 35% of recipients and 71% was allocated to the top 50% of recipients.
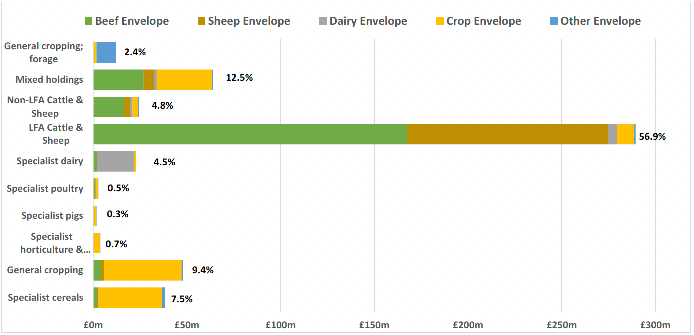
14. Figure 6 shows how the SO model allocates the sectoral envelopes to robust farm types (see Annex 2 for full data tables and boxplot). The LFA Cattle and Sheep sector was allocated 56.9% of 'direct' payments in 2019 (with 58% of those payments being through the beef envelope and 37% through the sheep envelope). Mixed holdings were allocated 12.5% of payments (with 46% from the crop envelope and 42% from the beef envelope). Specialist cereal producers were allocated 7.5% of total support and most (88%) of their allocation was through the crop envelope. The specialist pig, horticulture and poultry sectors were only allocated 1.6% of support collectively in 2019.
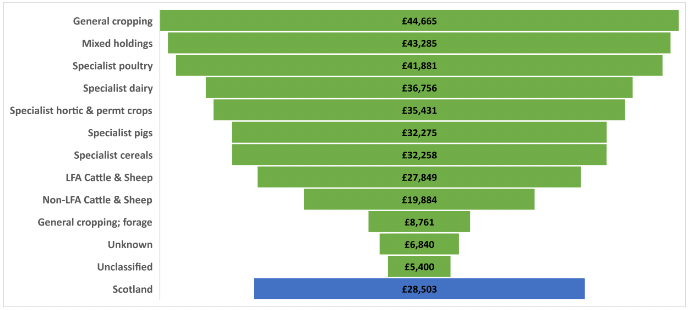
15. Figure 7 shows the mean level of 'direct' support received by robust farm type in 2019 (noting large variation within each sector). Across Scotland recipients received an average of £28,503 in 'direct' support with the highest average payments (£44,665) to General Cropping businesses. Whilst specialist poultry farms only receive a small proportion of the total funding, on average they received £41,881 in 'direct' support – with payments to other activities, such as cropping or grazing livestock, other than poultry (the same is true for specialist horticulture and pig businesses).
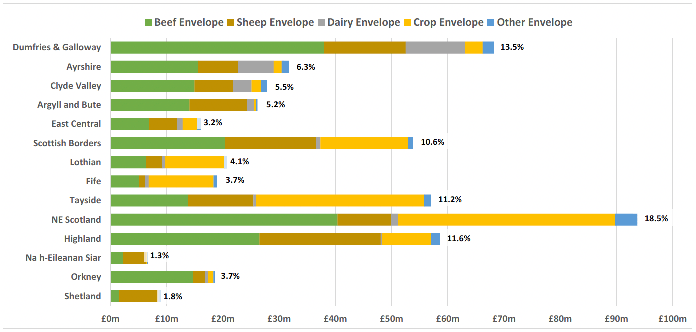
16. Figure 8 shows the allocation of payments by sectoral envelopes within agricultural regions of Scotland (see Annex 5 for a map). 3,178 recipients in North East of Scotland received 18.5% (£93.8m) of 'direct' payments in 2019 with 43% allocated from the beef envelope and 41% from the crop envelope (see Annex 3 for detailed tables and boxplot). 1,805 recipients in Dumfries and Galloway received 13.5% (£68.2m) of payments with 56% of this allocated through the beef envelope, 21% the sheep envelope and 16% the dairy envelope. In contrast, the 1,357 Na h-Eileanan Siar recipients received 1.8% (£6.7m) of 'direct' support payments with 62% allocated through the sheep envelope and 33% the beef envelope.
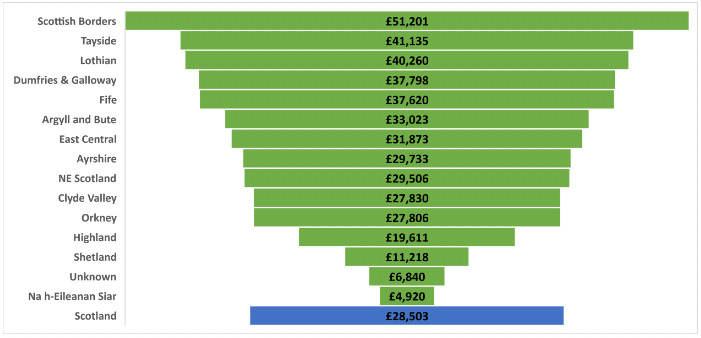
17. Figure 9 shows the mean level of 'direct' support received within agricultural regions in 2019 (noting large variation within each geography). Reflecting the larger average sized businesses the largest average payments were in the Borders (£51,201) followed by Tayside (£41,135) and Lothian (£40,260). In contrast, in Na h-Eileanan Siar recipients only received £4,4920 on average (reflecting many smaller scale crofters) with the average Shetland receipt being £11,218.