
Scottish Housing Market Review Q2 2026
Quarterly bulletin collating a range of previously published statistics on the latest trends in the Scottish housing market.
Part of
7. Mortgage Affordability
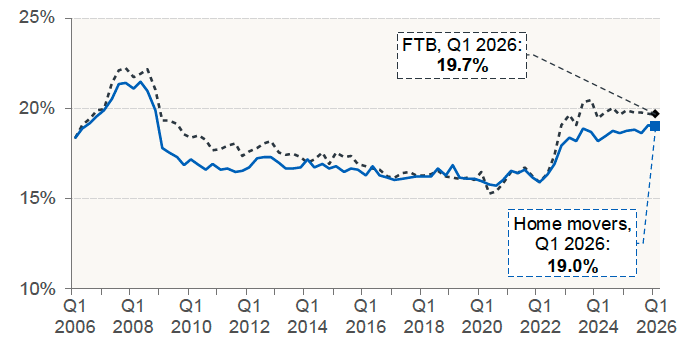
Chart 7.1 shows the share of borrower income taken up by capital and interest payments for new mortgages. In Q4 2025, the share of home movers’ income taken up by capital and interest payments was 19.1% – its highest level since Q4 2008 which was during the Global Financial Crisis. However, over the quarter, the share has decreased slightly to 19.0% in Q1 2026.
Among first-time buyers, across the 18 months to March 2026, the proportion has remained broadly stable at around 19.8%. Latest quarterly data for Q1 2026, shows that the proportion of income taken up by capital and interest payments was 19.7%, which represents a slight decrease from recent levels.
Chart 7.1 Average (mean) capital-and-interest-payments-to-income ratio for new mortgages to First Time Buyers (FTB) and Home Movers, Scotland (Quarterly data, to Q1 2026)
Source: UK Finance
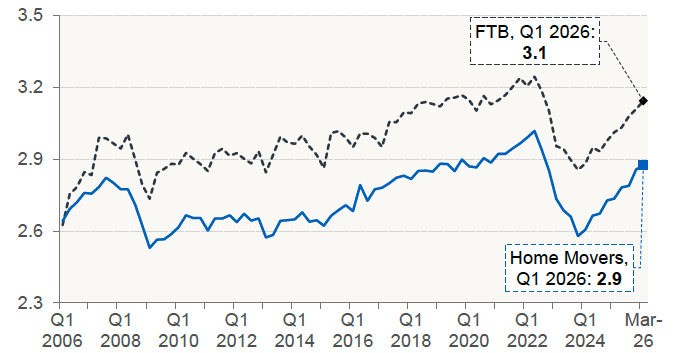
Chart 7.2 shows that there have been consistent quarterly increases in average house-price-to-income ratios during the 15 months to the end of March 2026, but they remain below the levels immediately prior to Q2 2022. Over the year to Q1 2026, for home movers the ratio increased from 2.7 to 2.9. Over the same time period, the ratio for first-time buyers increased from 3.0 to 3.1, indicating a modest deterioration in affordability for both groups.
Chart 7.2 Average (mean) house-price-to-income ratio for new mortgages to FTB and Home Movers, Scotland (Quarterly data, to Q1 2026)
Source: UK Finance
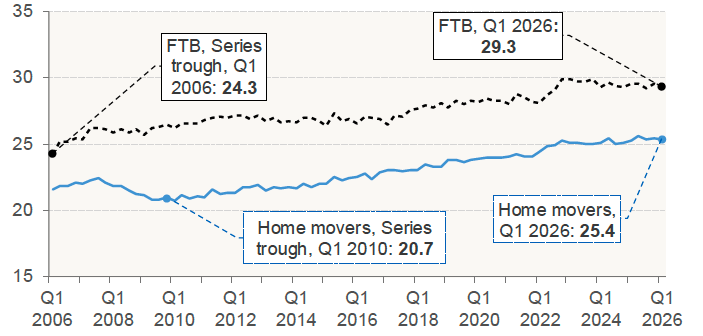
To make their monthly repayments more manageable, an increasing share of borrowers have responded by taking out longer mortgages. Chart 7.3, which relates to Scotland, shows that this is part of a longer-term trend.
Chart 7.3 Average (mean) mortgage term in years for new mortgages: Scotland (Quarterly data, to Q1 2026)
Source: UK Finance
Contact
Email: Bruce.Teubes@gov.scot