
Scottish Housing Market Review Q2 2026
Quarterly bulletin collating a range of previously published statistics on the latest trends in the Scottish housing market.
Part of
2. House Prices
2.1. Scottish House Price Performance: National
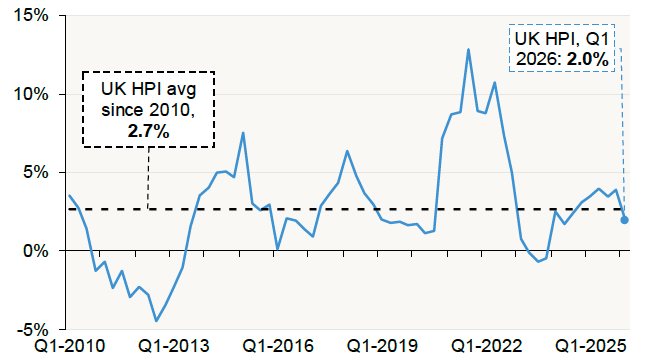
Chart 2.1 Annual house-price growth: Scotland (Quarterly data, to Q1 2026)
Source: UK HPI
UK House Price Index (HPI) data shows that the average house price in Scotland in 2025-26 was £190,000, an increase of 3.3% relative to 2024-25. While house-price growth accelerated steadily throughout 2024 and into early 2025, more recent data suggest that growth may have softened. The annual growth rate slowed from 3.9% in Q4 2025 to 2.0% in Q1 2026, the lowest since Q2 2024, when growth stood at 1.7%.
Registers of Scotland data shows that the average (arithmetic mean) house price in Scotland increased annually by 1.5% to £227,000 in Q1 2026. Registers of Scotland data is not mix-adjusted, so it will be affected by the composition of properties sold.
2.2. Scottish House Price Performance by Dwelling/Buyer Type
In recent editions of the Scottish Housing Market Review, we have not included the UK HPI breakdown of new build and existing property price estimates in Scotland, because, as the ONS has noted, a fall in the proportion of transactions which are processed by HM Land Registry in time for their inclusion in initial HPI estimates has meant that revisions have been larger than usual.
With respect to property type, UK HPI data shows that annual house price growth in Q1 2026 was highest for semi-detached properties at 3.8%, followed by terraced (3.4%) and detached properties (2.2%). Out of all property types, flats and maisonettes had the slowest rate of price growth during the year at 0.3%.
The UK HPI also shows that the average price of a property bought by former owner occupiers in Scotland increased annually by 2.0% in Q1 2026 to £234,000. Meanwhile, the average price of a property purchased by a first-time buyer increased annually by 1.9% to £154,000.
2.3. Scottish House Price Performance: Local Authorities
Table 2.1 sets out the level and annual change in quarterly house prices by local authority. The small number of sales in some local authorities, such as the island local authorities, can lead to some volatility in estimated house prices despite the HPI methodology adjusting for the mix of houses sold; therefore, the change in average house prices in the last four quarters compared to the preceding four quarters is also presented. [3]
The longer-term trend shows that 29 of the 32 local authorities saw an increase in their average house price in the four quarters to Q1 2026 relative to the previous four quarters. Average house prices increased the most in the Orkney Islands (8.3%), followed by Renfrewshire (6.9%) and Argyll and Bute (6.4%). The three local authorities that recorded decreases were Aberdeen City (-4.4%), Na h-Eileanan Siar (-1.0%) and Aberdeenshire (-0.5%) . Although these changes were calculated over a longer time period, the notable increase in Orkney Islands and decrease in Na h-Eileanan Siar should be interpreted with caution due to the low number of sales in island local authorities (See Table 1.1).
| Local Authority | Prices - Q1 2026 | Q1 2026 on Q1 2025 | 4 quarter to Q1 2026 on previous 4 quarters |
|---|---|---|---|
| Aberdeen City | £131,320 | -4.6% | -4.4% |
| Aberdeenshire | £198,103 | 0.7% | -0.5% |
| Angus | £170,625 | 4.2% | 2.5% |
| Argyll and Bute | £180,274 | 5.7% | 6.4% |
| Clackmannanshire | £164,334 | 3.4% | 2.8% |
| Dumfries and Galloway | £162,574 | 1.4% | 3.2% |
| Dundee City | £134,239 | 0.7% | 1.9% |
| East Ayrshire | £129,559 | 4.9% | 4.5% |
| East Dunbartonshire | £266,177 | 4.8% | 5.0% |
| East Lothian | £276,203 | -0.9% | 1.3% |
| East Renfrewshire | £290,392 | 2.4% | 2.0% |
| City of Edinburgh | £293,421 | 2.4% | 4.7% |
| Falkirk | £167,906 | 3.2% | 3.5% |
| Fife | £171,956 | 2.8% | 4.0% |
| Glasgow City | £185,801 | 2.5% | 5.1% |
| Highland | £211,994 | 2.4% | 1.8% |
| Inverclyde | £112,763 | 6.6% | 3.0% |
| Midlothian | £274,465 | 0.6% | 1.9% |
| Moray | £200,548 | 4.0% | 1.1% |
| Na h-Eileanan Siar | £135,860 | -3.4% | -1.0% |
| North Ayrshire | £133,068 | 4.6% | 5.6% |
| North Lanarkshire | £151,741 | 3.9% | 5.6% |
| Orkney Islands | £227,153 | 10.1% | 8.3% |
| Perth and Kinross | £218,151 | 1.6% | 5.2% |
| Renfrewshire | £159,052 | 5.6% | 6.9% |
| Scottish Borders | £182,387 | 3.1% | 3.7% |
| Shetland Islands | £184,604 | -9.2% | 0.9% |
| South Ayrshire | £163,026 | 2.1% | 0.0% |
| South Lanarkshire | £177,434 | 4.2% | 5.8% |
| Stirling | £225,755 | 1.6% | 1.5% |
| West Dunbartonshire | £125,718 | 6.0% | 1.3% |
| West Lothian | £217,849 | 1.6% | 3.0% |
| Scotland | £187,421 | 2.0% | 3.3% |
Source: ONS HPI
Contact
Email: Bruce.Teubes@gov.scot