
Scottish Housing Market Review Q2 2026
Quarterly bulletin collating a range of previously published statistics on the latest trends in the Scottish housing market.
Part of
1. Sales
1.1. Scottish Sales Performance: National
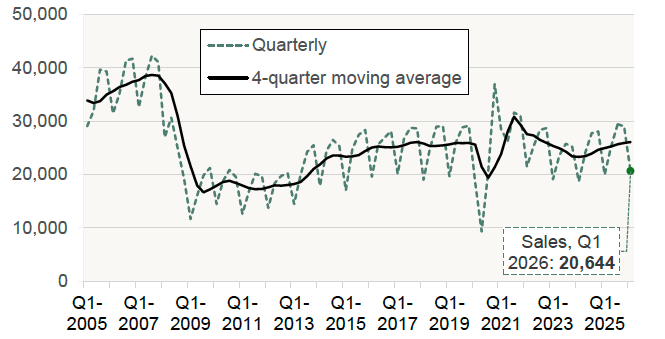
Chart 1.1 Number of residential property sales registered: Scotland (Quarterly data, to Q1 2026)
Source: Registers of Scotland
Chart 1.1 shows the volume of sales for each quarter and the 4-quarter moving average which gives a better indication of the longer-term trend.[1]
Across Scotland, in 2024-25 the number of registered property sales was 99,832. In 2025-26, this increased by 4.5% to 104,339. Most of this growth occurred in the first half of the financial year, with annual growth rates[2] of 4.9% in Q2 2025 and 6.1% in Q3 2025 then slowing to 3.5% in Q4 2025 and 3.3% in Q1 2026.
The military conflict in the Middle East which began on 28 February 2026 is likely to further reduce transactions growth through its impact on mortgage interest rates (see Section 6). Indeed, more recent data from Registers of Scotland shows that transactions growth has turned negative, with sales in the 3 months to May 2026 down by around 1% on an annual basis.
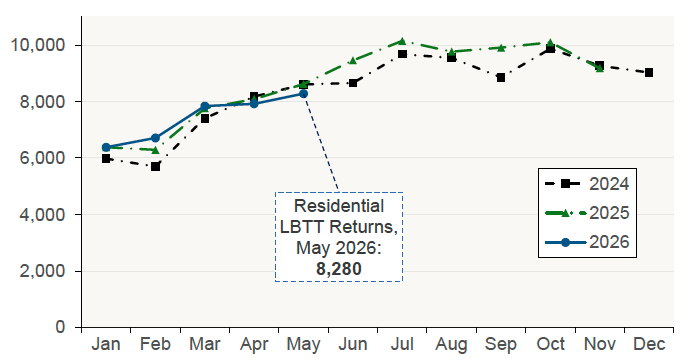
LBTT data presents a similar picture. Chart 1.2 shows that, although returns were higher in the first three months of 2026 compared with the same months in 2025, this trend reversed in April and May, with returns falling by 2.1% and 3.9%, respectively, relative to a year earlier.
Chart 1.2 Residential LBTT returns (Monthly data, to May 2026)
Source: Revenue Scotland
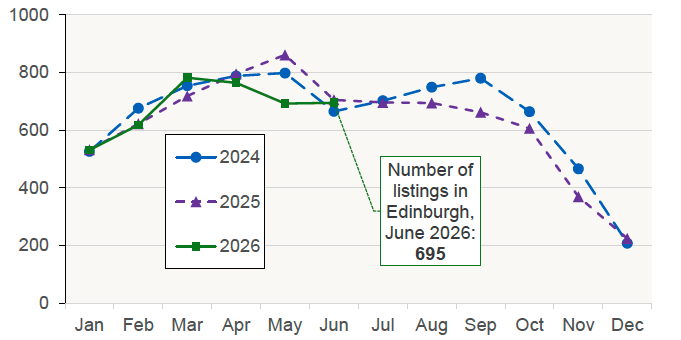
Listings data can provide a leading indicator for transactions. Chart 1.3 shows the monthly number of residential property listings in the City of Edinburgh advertised through the Edinburgh Solicitors Property Centre (ESPC) between January 2024 and June 2026. While listings increased by an annual 3.2% in Q1 2026, they fell by an annual 8.9% in Q2 2026, suggesting that the slowdown in transactions observed in recent months may persist.
Chart 1.3 Number of residential properties listed by ESPC: City of Edinburgh (Monthly data, to June 2026)
Source: ESPC
1.2. Scottish Sales Performance: Local Authorities
Table 1.1 sets out the level and annual change in quarterly transactions by local authority. The transaction volumes at local authority level can fluctuate significantly, particularly in smaller local authorities such as the island local authorities. To reduce this volatility, the change in transactions in the last four quarters compared to the preceding four quarters is also presented.
Table 1.1 shows that the number of residential property sales has increased in most local authorities in Scotland in the four quarters to Q1 2026, compared to the preceding four quarters. The local authorities with the highest growth rates were East Lothian (15.4%) and Midlothian (14.2%), significantly above the Scotland-wide average of 4.5%. Over the same period, three local authorities recorded falls in transactions: Orkney Islands (-6.6%), the City of Edinburgh (-3.0%), and Argyll and Bute (‑2.5%).
| Local Authority | Sales - Q1 2026 | Q1 2026 on Q1 2025 | 4 quarters to Q1 2026 on previous 4 quarters |
|---|---|---|---|
| Aberdeen City | 1,047 | 13.4% | 10.2% |
| Aberdeenshire | 812 | -9.0% | 5.5% |
| Angus | 376 | -8.7% | 9.9% |
| Argyll and Bute | 305 | -21.0% | -2.5% |
| City of Edinburgh | 2,148 | -6.5% | -3.0% |
| Clackmannanshire | 173 | 14.6% | 7.5% |
| Dumfries and Galloway | 571 | 35.3% | 10.5% |
| Dundee City | 550 | 5.0% | 5.2% |
| East Ayrshire | 456 | 7.0% | 6.2% |
| East Dunbartonshire | 353 | 11.4% | 0.9% |
| East Lothian | 530 | 12.8% | 15.4% |
| East Renfrewshire | 315 | 7.1% | 2.7% |
| Falkirk | 531 | 2.5% | 2.4% |
| Fife | 1,318 | -3.4% | 1.8% |
| Glasgow City | 2,272 | 5.6% | 4.3% |
| Highland | 856 | -0.9% | 3.4% |
| Inverclyde | 270 | -10.6% | 3.9% |
| Midlothian | 401 | 4.7% | 14.2% |
| Moray | 317 | 2.3% | 12.5% |
| Na h-Eileanan Siar | 72 | -2.7% | 3.0% |
| North Ayrshire | 621 | 2.3% | 13.7% |
| North Lanarkshire | 1,091 | 0.6% | 4.6% |
| Orkney Islands | 53 | 6.0% | -6.6% |
| Perth and Kinross | 616 | 3.0% | -0.9% |
| Renfrewshire | 862 | 18.4% | 6.6% |
| Scottish Borders | 400 | -2.0% | 4.6% |
| Shetland Islands | 56 | 3.7% | 7.2% |
| South Ayrshire | 447 | 5.4% | -0.5% |
| South Lanarkshire | 1,316 | 2.7% | 2.4% |
| Stirling | 384 | 19.6% | 8.5% |
| West Dunbartonshire | 341 | 24.0% | 13.6% |
| West Lothian | 784 | 15.8% | 9.4% |
| Scotland | 20,644 | 3.3% | 4.5% |
Source: Registers of Scotland
Contact
Email: Bruce.Teubes@gov.scot