
Scottish Housing Market Review Q2 2026
Quarterly bulletin collating a range of previously published statistics on the latest trends in the Scottish housing market.
Part of
6. Mortgage Interest Rates
After a tightening cycle which took Bank Rate from 0.1% prior to the December 2021 Monetary Policy Committee (MPC) meeting to 5.25% following the August 2023 meeting, its highest level since 2008, the MPC held Bank Rate steady for the following 12 months. The MPC then cut Bank Rate in regular increments of 0.25% points until it stood at 3.75% in December 2025.
The military conflict in the Middle East has disrupted international trade flows and created significant uncertainty in global energy markets. The MPC has warned that the resulting energy and supply shock could increase CPI inflation later in 2026 and lead to broader inflationary pressures. To ensure inflation returns sustainably to the 2% target, the MPC has kept Bank Rate unchanged at 3.75% at its last four meetings on 5 February 2026, 19 March 2026, 30 April 2026 and 18 June 2026. The next meeting is scheduled for 30 July 2026.
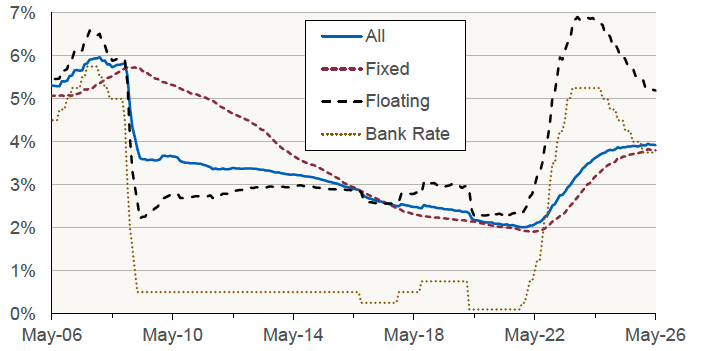
Chart 6.1 and Chart 6.2 shows the effective (or average) interest rates on new mortgage advances and outstanding mortgage balances in the UK. [Source: Bank of England]. In the UK, there is typically a lag between a borrower securing a mortgage offer and the mortgage transaction completing, meaning changes in mortgage pricing can take several months to feed through to housing activity and household borrowing costs.
Reflecting successive reductions in Bank Rate beginning in August 2024, the average interest rate on new floating‑rate mortgage advances fell by 1.5 percentage points to 4.39% over the period from August 2024 to January 2026. Since then, the average rate has edged up slightly, increasing by 0.05 percentage points to 4.44% in May 2026. For new fixed‑rate mortgages, the average rate declined by 0.7 percentage points to 4.07% over the period from August 2024 to January 2026. More recently, however, it has increased modestly, rising by 0.13 percentage points to 4.20% in May 2026.
Between August 2024 and January 2026, the average rate on outstanding floating-rate mortgages fell from 6.71% to 5.26% (down 1.5 percentage points). Unlike new mortgage advances, the average interest rate on outstanding mortgages with floating rates has continued to edge downwards between January 2026 and May 2026 (down 0.07 percentage points to 5.19%).
The average rate on outstanding fixed-rate mortgages, which had been on an upward trend since early 2022, due to mortgages which reached the end of their fixed period being refinanced at higher rates, has finally shown signs of levelling off, with the 3.80% recorded in May 2026 slightly down from the recent peak of 3.83% in February 2026. However, with interest rates now anticipated to be higher than they would have been due to conflict in the Middle East, this levelling off is likely to prove temporary. According to the latest Financial Stability Report, published in July 2026, the Bank of England’s Financial Policy Committee expects that the typical (median) UK owner-occupier mortgagor rolling off a fixed rate in the next two years will face an increase in their monthly mortgage repayments of £45. However, this is significantly smaller than increases experienced over the last few years, with the median repayment increasing by approximately £120 between the end of 2022 and end of 2024.
Effective monthly interest rates on mortgage lending to households: UK (Data as at month-end, to May 2026)
Chart 6.1 New balances
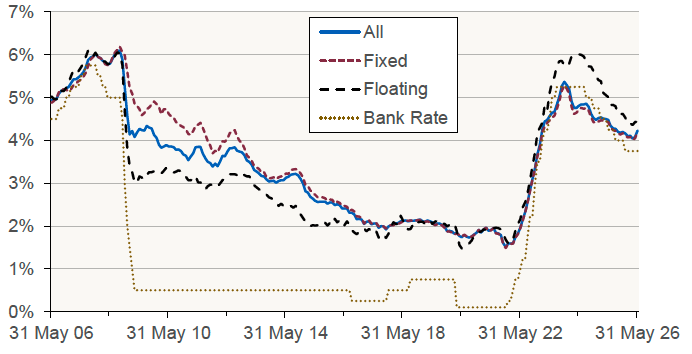
Chart 6.2 Outstanding mortgages
Source: Bank of England
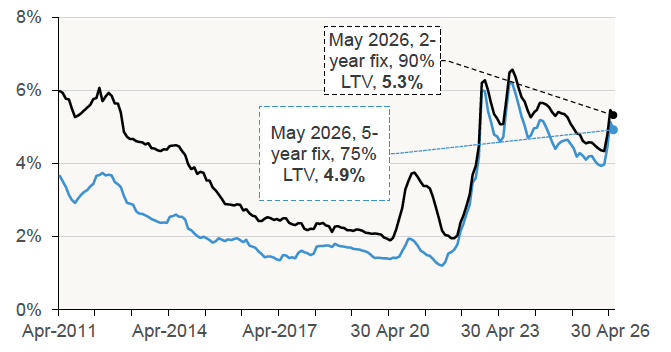
Bank of England data on advertised mortgage rates (as opposed to data in Chart 6.1 which is based on interest actually paid) shows that advertised mortgage rates have risen sharply since the recent military conflict in the Middle East began on 28 February 2026. The average advertised two-year fixed rate for a 75% LTV mortgage has increased from 4.0% in January to 4.9% in May. Similarly, over the same period the average mortgage rate for a two-year fix for a 90% LTV mortgage has increased from 4.3% to 5.3%. Despite recent increases, average advertised mortgage rates remain below the peaks reached in the summer of 2023.
Chart 6.3 Average 2-year fixed-rate 90% and 75% LTV advertised mortgage rates, UK (Data as at month-end, to May 2026)
Source: Bank of England
Data from the Moneyfacts Treasury Report, which presents advertised mortgage rates averaged across loan-to-value (LTV) bands, shows that the average two-year fixed mortgage rate increased from 4.83% in January 2026 to 5.68% in June 2026. This was also higher than the average rate of 5.12% recorded in June 2025. Similarly, the average 5-year fixed-rate increased from 4.91% in January 2025 to 5.63% in June 2026, which is higher than a year previously (5.09%).
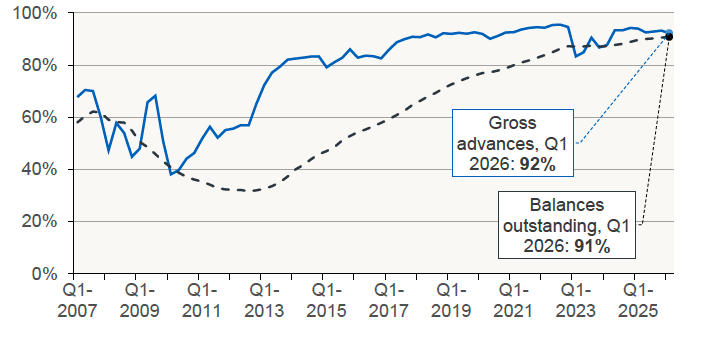
Chart 6.4 shows that the vast majority of regulated[4] mortgages are on fixed rates. The share of gross advances on fixed rates in Q1 2026 was 92%, while the share of outstanding balances on fixed rates in Q1 2026 was 91%. (Source: FCA).
Chart 6.4 Share of regulated mortgage lending at fixed rates, UK (Quarterly data, to Q1 2026)
Source: FCA
Contact
Email: Bruce.Teubes@gov.scot