
Scottish Housing Market Review Q2 2026
Quarterly bulletin collating a range of previously published statistics on the latest trends in the Scottish housing market.
Part of
5. Mortgage Advances, Approvals and LTVs
5.1. New Mortgage Advances
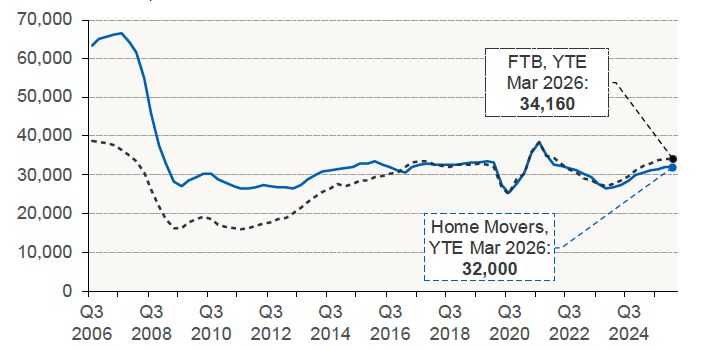
Chart 5.1 shows the trend in new mortgages advanced for home purchase, using a four-quarter moving total [Source: UK Finance]. A mortgage advance is a mortgage loan that has been paid out by the lender. In 2025-26, new mortgages advanced to home movers in Scotland grew by an annual 4.4%, although this represented a slowing in the growth rate from 2024-25, when the annual increase was 15.0%. A similar pattern is evident in mortgages advanced to first-time buyers in Scotland, which increased by an annual 6.0% in 2025-26, lower than the 17.0% annual growth recorded in 2024-25.
This slowdown is also evident within 2025-26, with the annual growth rate for new mortgages to home movers slowing from 6.0% in Q2 2025 to 1.4% in Q1 2026, while for first-time buyers the annual growth rate fell from 8.9% in Q2 2025 into negative territory, at -0.9% in Q1 2026.
Chart 5.1 New mortgage advances for home purchase: Scotland (4-quarter moving total, to Q1 2026)
Source: UK Finance
5.2. Mortgage Approvals
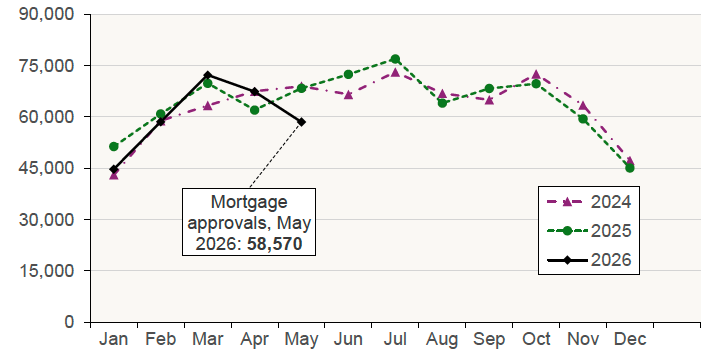
Chart 5.2 plots the monthly number of mortgage approvals across the UK for house purchase by individuals. Mortgage approvals for house purchase, which are the firm offers of lenders to advance credit fully secured on dwellings by a first-charge mortgage, are a leading indicator of mortgage sales as they reflect activity early in the buying process.
The number of mortgage approvals in the UK fell by an annual 3.6% in Q1 2026. A similar fall is evident in the most recent months, with the number of mortgage approvals across April and May 2026 falling by an annual 3.4%. [Source: Bank of England].
Chart 5.2 Mortgage approvals for house purchase by individuals: UK (Monthly data, to May 2026)
Source: Bank of England
5.3. Loan-to-Value (LTV) Ratios
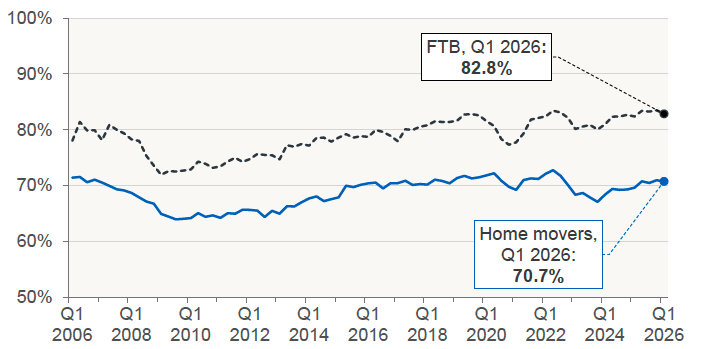
Chart 5.3 shows that the mean LTV ratio declined over the quarter for both first-time buyers and home movers. For first-time buyers, the ratio fell from 83.5% to 82.8%, while for home movers it decreased from 71.0% to 70.7% in Q1 2026. However, despite these quarterly falls, LTV ratios for both groups remained higher than a year earlier, when they stood at 82.4% and 69.6% respectively. [Source: UK Finance]
Chart 5.3 Mean Loan-to-Value ratio on new mortgages: Scotland (Quarterly data, to Q1 2026)
Chart 5.3 Mean Loan-to-Value ratio on new mortgages: Scotland (Quarterly data, to Q1 2026)
Source: UK Finance
Chart 5.4 shows that the share of higher-risk lending within total regulated residential lending across the UK rose steadily throughout 2025. However, the share of regulated residential lending across the UK with an LTV greater than 90% fell over the quarter, declining from 9.1% to 8.8% in Q1 2026. Similarly, the share of loans with both an LTV greater than 90% and a high income multiple decreased, from 6.9% to 6.7% over the same period. Despite this fall, other than Q4 2025, the respective shares were at their highest level since 2008, prior to the financial crisis.
Chart 5.4 Higher-risk lending as a share of all regulated residential lending to individuals: UK (Quarterly data, to Q1 2026)
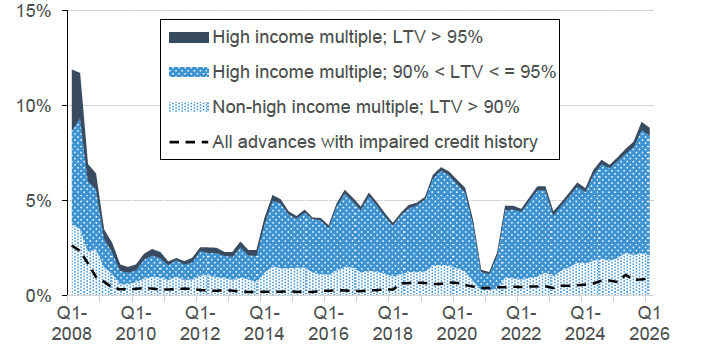
Source: FCA. Higher-risk lending is classified by the FCA as an LTV over 90% or an income multiple greater than or equal to 3.5 for single-income purchasers or 2.75 for joint-income purchasers.
The total number of residential mortgage products increased by 384 over the month to stand at 7,132 in early June 2026, which is the highest since March 2026 (7,484). Over the month, product availability increased across all LTVs. The largest rise occurred in the 80% LTV tier, where the number of products grew by 76, reaching a total of 952. [Source: Moneyfacts UK Mortgage Trends Treasury Report]
The number of buy-to-let (BTL) mortgage products rose from 4,144 in June 2025 to 5,194 in June 2026, an annual increase of 25.3%. However, this remained below the series high of 5,747 products recorded in February 2026. [Source: Moneyfacts UK Mortgage Trends Treasury Reports]
Contact
Email: Bruce.Teubes@gov.scot