Scotland's seas: towards understanding their state
Scotland's seas: towards understanding their state.
Chapter 3 Clean and Safe Seas
INTRODUCTION
Scottish coastal seas support some of the most productive marine ecosystems in the world and this reflects, amongst other things, the general high quality of our marine waters. Scotland's low population density and position on the north-western seaboard of Europe have ensured that there has been relatively little contamination of the seas and any contaminants that have been released have an opportunity to dilute and disperse. Inevitably, as in any developed country, Scotland has an industrial history and as could be expected, where industrial development in the central belt was concentrated, some water quality problems remain some of which result from historical contamination.
The sea acts as a sink for virtually all the substances (and hence pollution [A]) that enter fresh waters and also receives chemical contaminants from the atmosphere, some of which may not originate in Scotland. Domestic inputs of contaminants to the seas and estuaries have demonstrably been reduced in the last 30 years as improved legislation and statutory powers, and an understanding of the consequences of pollution, have enabled Scotland increasingly to regulate the discharges from key polluters.
A clean and healthy sea is, of course, not just about chemicals in the water. It also relates to all changes that can affect animal and plant life at any stage in their life cycles. Other significant deterioration in quality can come from a lack of water clarity caused by increased turbidity (see Chapter 2), noise from man-made sources or temperature changes caused by effluents that are significantly warmer or colder than their receiving waters. Intensive agriculture has led to a big increase in very fine soil particles containing nutrients being washed from land to sea. Bottom sediments must also remain healthy as many sites are highly productive or contain unique habitats of conservation interest. Even climate change linked processes, such as acidification of the sea caused by increased concentrations of carbon dioxide in the atmosphere, can affect the survival of some species. Changes in storminess or rainfall have also been linked to climate change and can influence freshwater run-off from land or marine circulation patterns. Bacterial contamination of inshore seas comes from both human derived sewage and diffuse run-off from land with bacteria derived principally from farming of livestock.
As highlighted in Chapter 1, work to maintain and improve the cleanliness of the seas has been greatly helped by a wide range of legislation and conventions, most of which now originate from the EU. Regulating agencies aim to use all available legislation to ensure that Scotland's seas are clean and safe and to meet the OSPAR objective to continually reduce discharges with the ultimate target of achieving concentrations near background values for naturally occurring substances, close to zero for manmade synthetic and radioactive substances, and with no discernable eutrophication attributable to human derived inputs. The recent Marine Strategy Framework Directive ( MSFD) adds to this by introducing the concept of achieving good environmental status ( GES) (Table 3.1).
Table 3.1 Qualitative MSFDGES descriptors for clean and safe seas
MSFD Annex I GES descriptors |
|---|
GES Descriptor 5 - Human-induced eutrophication is minimised, especially adverse effects thereof, such as losses in biodiversity, ecosystem degradation, harmful algae blooms and oxygen deficiency in bottom waters |
GES Descriptor 8 - Concentrations of contaminants are at levels not giving rise to pollution effects |
GES Descriptor 9 - Contaminants in fish and other seafood for human consumption do not exceed levels established by Community legislation or other relevant standards |
GES Descriptor 10 - Properties and quantities of marine litter do not cause harm to the coastal and marine environment |
GES Descriptor 11 - Introduction of energy, including underwater noise, is at levels that do not adversely affect the marine environment |
EVIDENCE THAT THE SEA IS CLEAN AND SAFE
As discussed in Chapter 1 the vision of clean and safe was developed in the report Safeguarding our Seas and is used to steer one of the evidence groups as part of the UKMMAS. Clean and safe in this context is taken as principally relating to the chemical, eutrophic, bacteriological and litter status of Scottish seas. The chemical status in particular is multi-faceted as it can relate to water concentrations of toxic or hazardous substances or measures of these compounds in sediments or biota as well as covering radioactive substances. For persistent substances, measurement of concentrations in biota or sediments is preferred as they integrate the build up with time. A number of specific programmes are in place to collect evidence each having one or more regulatory or international convention drivers that frame the monitoring programme. The principal programmes are listed in Annex 2. These programmes assess both the risk to humans (e.g. through shellfish consumption, radioactive substances critical dose assessments or bathing water quality), as well as to the marine ecosystem (e.g. by measuring concentrations of nutrients and xenobiotics). The monitoring sites are varied, but many are coastal, with a focus either on areas under pressure or on areas that have had significance to man in terms of waste disposal, industrial development, finfish or shellfish production. Samples are taken from sediments, biota and water depending on the programme. Table 3.2 summarises some of the data available that are used to determine if Scotland's seas are clean and safe.
SEPA collects data on the flow of all major rivers, which are gauged close to their tidal limits (see Figure 2.10). As the concentrations of contaminants and nutrients in these rivers are also measured (see Case Study 3.1), along with all key point source discharges, total loads of pollutants to coastal stretches can be calculated. Information of the pollutant loads entering the sea is essential to help scientists understand the complex relationship between these inputs and the levels found in the marine environment.
Classification of waters
Even though the discharge of contaminants into the sea is more under control than it has ever been, it is still necessary to assess environmental quality directly. The search for an overall indicator of marine health is not new and SEPA annually classified the environmental quality of coastal margins and estuaries up until 2006 (see case study 3.2) but this was replaced in 2007 by a more thorough classification using WFD 2000/60/ EC methods which are described in Case Study 3.3. The WFD only extends to 3 nautical miles from the Scottish baseline but the new MSFD will operate in a similar manner and cover more offshore seas out to the national territorial limit.
Table 3.2 Summary of data collected that could indicate whether Scotland's seas are clean and safe
Indicators of clean and safe seas |
Principal data collectors |
|---|---|
Contaminants in food (excluding phycotoxins) |
FSAS, FRS |
Contaminants in the environment |
FRS, SEPA, SMRU, Shetland Oil Terminal Environmental Advisory Group ( SOTEAG), Advisory Committee on Protection of the Sea ( ACOPS), Defra on behalf of various monitoring authorities |
Eutrophication |
FRS, SEPA, Sir Alister Hardy Foundation for Ocean Science ( SAHFOS) |
Integrated classification |
SEPA |
Litter |
Local Authorities International Environmental Organisation ( KIMO), Marine Conservation Society, Plymouth University, SEPA |
Microbiology |
SEPA, FSAS, FRS, Shetland Seafood Quality Control |
Radioactive Substances |
SEPA, CEFAS |
Toxins |
FRS, FSAS, SEPA, SAMS |
CASE STUDY 3.1 Loadings on Riverine Inputs and Direct Discharges ( RID)
Chemical contaminant inputs to the marine environment
Chemical contaminants enter the marine environment by direct or indirect release to rivers, from industrial discharges and from sewage works discharges. SEPA measures the concentrations of a range of contaminants in larger rivers and industrial and other discharges, and these are multiplied by the appropriate flows to give the so-called RID inputs as annual loadings in kilograms or tonnes (1).
These loadings are reported annually to OSPAR, set up to administer the 1992 OSPAR Convention which covers many of the human activities that might adversely affect the marine environment of the North-East Atlantic Ocean.
The substances for which loadings are calculated fall into the following categories:
- metals, including cadmium, mercury, lead, copper and zinc;
- organic compounds, including lindane and polychlorinated biphenyls ( PCBs); and
- plant nutrients that may contribute to eutrophication, including compounds of nitrogen and phosphorus.
How the information is gathered for Scotland
Scotland has been divided into seven areas for the purpose of gathering information on the loadings of the substances listed above. Tables of loadings are collated for the rivers, industrial discharges and sewage works discharges to each area for each individual substance. These loadings data can be interpreted by area and year to identify where inputs are highest or over time for each area, to assess trends with time.
Examples of trends in metals inputs over time
The data show steady reductions in cadmium inputs to marine waters in both the rivers Forth and Clyde catchment areas (Figure 3.1a), and for lead in the Clyde catchment area (Figure 3.1b). These figures confirm that the UK has achieved the targets of 50% reductions in the loadings of these List I substances to the marine environment, as it pledged to do under the EU Dangerous Substances Directive.
Loadings data in relation to the state of the marine environment
Information on loadings of chemical contaminants from rivers, sewage works and direct discharges are important, as they help to determine the current state of Scotland's marine environment. For example, the metal loadings measured can be related to the concentrations of metals in marine mussels, which bio-accumulate these and other contaminants.
Nutrient inputs in relation to eutrophication
Nutrients data are collected in the same way and discussed separately in Case Study 3.8.
Figure 3.1a Discharges of metals to Scottish marine waters, 1990-2004
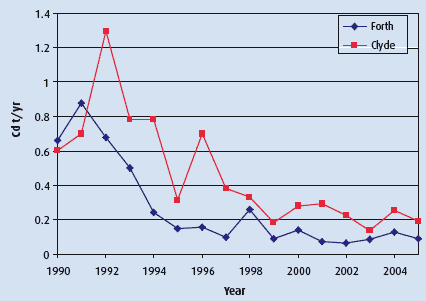
Cadmium in the Forth and Clyde Catchment Areas
Figure 3.1b Discharges of metals to Scottish marine waters, 1990-2004
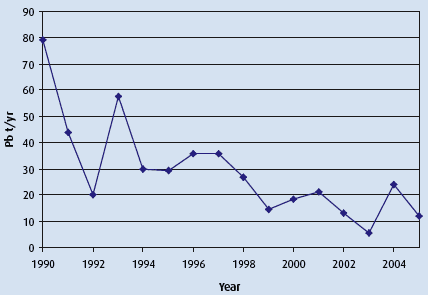
Lead in the Clyde Catchment Area
Summary Assessment
Parameter |
Geographical region |
Key factors & pressures |
What the evidence shows |
Trend |
Status now |
Confidence in assessment |
Reason for overall status |
|---|---|---|---|---|---|---|---|
Riverine inputs and direct discharges |
Scotland |
Metals & organics Inputs |
Higher inputs from industrialised areas |
|
III |
Very few Environmental Quality Standards ( EQSs) exceeded |
CASE STUDY 3.2 Coastal and estuarine water quality classification
Between 1996 and 2006 SEPA classified Scotland's saline waters using classification systems that are detailed in Annexes 7 and 8 of this report. Four classes were used (A-D) with A listed as excellent and D seriously polluted. This case study summarises the results of water quality assessments up to 2006 (2). In 2006, a new system for assessing water quality was introduced under the WFD and is described in Case Study 3.3.
Estuarine water quality
SEPA classified over 800 km 2 of estuaries in Scotland, using seven assessment criteria: aesthetics, fish migration, bottom-dwelling animals, resident fish, persistent substances, dissolved oxygen and dangerous substances. Results are given in area (km 2).
Between 2000 and 2006 the area of unsatisfactory or seriously polluted estuarine waters reduced by 2.8 km 2 (8.6%). This was a lower figure than had been hoped, largely because of the introduction of improved data and assessment methods. For example, the South Esk Estuary (Montrose Basin) had its classification downgraded, although there is no evidence that water quality in Montrose Basin had actually deteriorated.
Weather conditions can also have an impact on annual classifications. For example, wetter weather in 2002 led to higher river flows into the major estuaries, more dilution of pollutants, greater mixing, improved oxygen levels and higher classifications. A clearer overall picture of water quality can be achieved using a three-year average. The three-year average figure of Class C and D estuaries with improved water quality in 2006 (using 2006, 2005 and 2004 totals) was 21 km 2.
The quality of Forth and Clyde estuaries is especially affected by historically polluted sediments. The majority of the estuaries also continue to be impacted by sewage discharges. Diffuse run-off from urban and agricultural areas can also be significant sources of pollution (i.e. oils and nutrients). Some local issues remain with regards to aesthetics (litter) in estuaries which can draw public complaints.
Coastal water quality
SEPA classified almost 12,000 km of coastline in Scotland, using four assessment criteria: aesthetics, biological, bacteriological, and chemical condition. Results are given in coastal length (km).
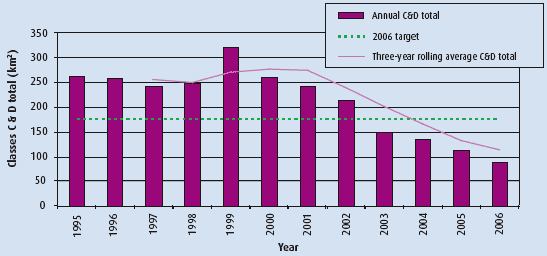
At the end of 2006, Scotland had only 90.5 km of unsatisfactory or seriously polluted coastal waters, a reduction of 72% since 2000. 94% of coastal waters were classified as excellent.
As in the case of the estuaries, coastal waters quality trends are expressed as a three-year rolling average of the total length of Class C and D waters, smoothing out the influence of particularly wet or dry years. As shown in Figure 3.2, the rolling average continued to fall in 2006 as it has done every year since. The amount of unsatisfactory and seriously polluted coastline in Scotland has steadily decreased since 1999. In 1999, the lengths making up the total of 322 km that required improvement were mostly next to significant population centres with inadequate sewage disposal arrangements, or were affected by agricultural or urban diffuse pollution.
Figure 3.2 Annual totals and three-year rolling average for Classes C and D coastal waters
Reasons for improvement
Continuing investment by both Scottish Water and industry resulted in lower contaminant concentrations in all saline waters. Key polluting industries have been targeted with improvement programmes, partly resulting from the results of the classification of their local waters. The decline of heavy industry, the use of a more integrated pollution control and an increasing environmentally aware public also contribute to a trend of improvement.
Future developments
A new water quality classification scheme, based on the mandatory requirements of the WFD came into force in 2006, Case Study 3.3.
Summary Assessment
Parameter |
Geographical region |
Key factors & pressures |
What the evidence shows |
Trend |
Status now |
Confidence in assessment |
Reason for overall status |
|---|---|---|---|---|---|---|---|
SEPA Estuary Classification-Based on study of aesthetic condition, fish migration, benthic community or bioassay, resident fish, persistent substances (biota) and water chemistry |
Scotland |
Main pressure comes from industrial and sewage direct and diffuse discharges. |
Historical contamination of sediments but continued improvement |
|
II |
Improvement in point sources, drive to control diffuse sources and decline in heavy industry |
|
SEPA Coastal Classification- Based on study of aesthetic condition, biological condition, bacteriological condition and chemical condition |
Scotland |
Main pressure comes from industrial and sewage direct and diffuse discharges. |
Steady Improvement in water quality |
|
II |
Improvement in point sources, drive to control diffuse sources and decline in heavy industry |
CASE STUDY 3.3 Water Framework Directive classification of transitional and coastal waters
The Directive (2000/60/ EC) ( WFD) establishes a new legal framework for the protection, improvement and sustainable use of surface waters, transitional waters, coastal waters and groundwater across Europe in order to:
- prevent deterioration and enhance status of aquatic ecosystems, including groundwater and saline waters out to 3 nautical miles from baseline (see Figure 3.3);
- promote sustainable water use;
- reduce pollution; and
- contribute to the mitigation of floods and droughts.
In Scotland, this work is being taken forward by SEPA(3), in conjunction with the Scottish Government and other partners in line with the timetable for action set out in the Directive and guidance agreed with other member states.
A classification approach determined by the WFD will be used to assess the ecological and chemical status of Scotland's saline waters which have been divided up into 507 transitional and coastal water bodies (see Figure 3.3). The results of this classification will help identify:
- significant risks to the environment;
- direct action to protect and improve surface waters; and
- assess the success of actions taken.
The first WFD classifications must be published at the end of 2009 and will be much wider ranging than previous SEPA coastal and estuarine classification schemes. Biological tools to carry out this monitoring have been developed by a UK national group and, where required, intercalibrated with similar tools in other Member States to ensure comparability of assessments. Monitoring work in line with WFD criteria began in the 2007 sampling year although not all the appropriate tools were complete at this time. Under the WFD, surface water status is determined by the lower of a water body's 'ecological status' and its 'chemical status'. Ecological status is determined using a number of 'quality elements', which look at biology, chemistry and physical influences on water quality. Table 3.3 lists the key elements that are to be looked at as part of the classification process.
Figure 3.4 shows a simple decision-tree to illustrate the classification process. Ecological status is measured by looking at the present state and comparing it against an ideal or reference condition for that water body.
Table 3.3 Key elements used in WFD Classification
Biological quality elements |
Transitional (estuaries & lagoons) |
Coastal waters | Artifical & heavily modified waters |
|---|---|---|---|
Phytoplankton |
|
|
As applicable |
Other plants |
|
|
As applicable |
Invertebrate animals |
|
|
As applicable |
Fish |
|
|
As applicable |
Supporting elements |
|||
Structural features |
|
|
As applicable |
Physico-chemical |
|
|
As applicable |
Specific pollutants |
|
|
As applicable |
Tidal regime |
|
|
As applicable |
Figure 3.3 Coastal and transitional water bodies delineated by the Water Framework Directive
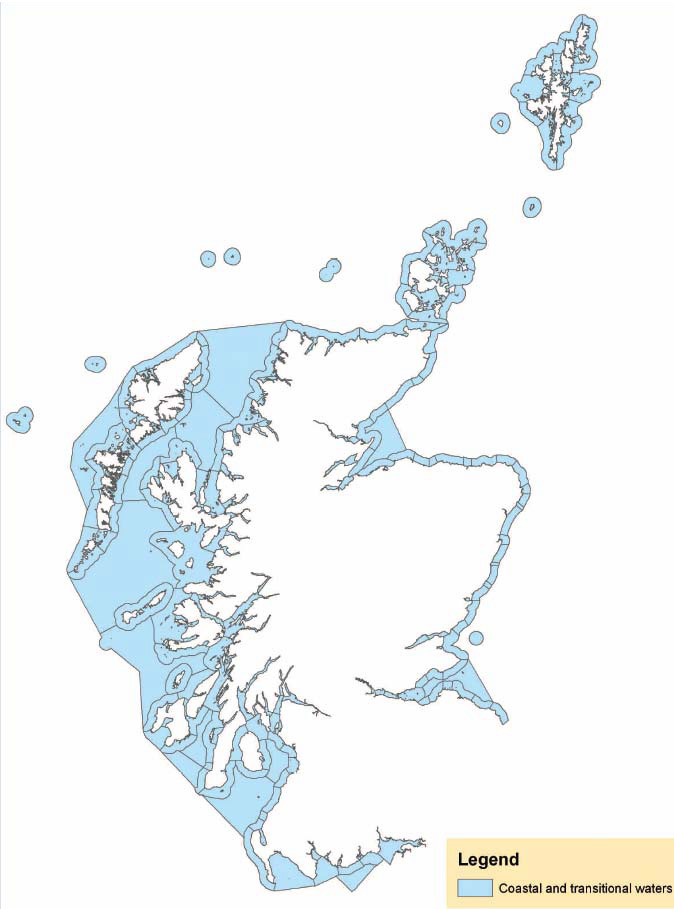
Figure 3.4 Decision-tree illustrating the criteria for determining the different ecological status classes

Summary Assessment
Parameter |
Geographical region |
Key factors & pressures |
What the evidence shows |
Trend |
Status now |
Confidence in assessment |
Reason for overall status |
|---|---|---|---|---|---|---|---|
WFD Classification using biological, chemical and physical criteria determined by the directive |
Scotland |
Pollution or physical pressures that reduce the "Health" of the inshore marine environment |
Too early to be precise but the majority of Scottish waters are expected to be of High Quality |
|
I |
Risk assessment and existing data though not yet strictly Water Framework Compliant |
Hazardous substances
Hazardous and persistent substances are of particular environmental concern as by definition they are toxic and/or very resistant to breaking down to safe constituents. Development of regulation correctly reflects our intolerance of these substances. Those of most concern also have the potential to build up in living tissue and the possibility of being concentrated up the food chain (e.g. brominated flame retardants) or follow a number of pathways to end up in the bottom sediments. While FRS and SEPA collect bioaccumulation data from fish, invertebrates and seaweeds, SMRU collect data from larger top predators such as seals who are particularly vulnerable to biomagnification up the food chain as discussed in Case Study 3.4.
In previous decades heavy industry was a serious pollution source for many toxic metals. Although these have largely declined there remain residual problems in historically contaminated sediments especially in the Clyde and Forth estuaries and a few sea lochs. Some removal of this contaminated sediment from, for example, the Clyde Estuary has occurred by natural scouring or dredging of the shipping channel but this has translocated the problem elsewhere. It is not surprising therefore, that there is a noticeable increase in contamination in the area used for dumping dredge spoil at the head of the Firth of Clyde close to the mouth of the Holy Loch. Data collected by BGS on naturally occurring minerals in seabed sediments are an essential aid in helping understand the extent of human derived metal pollution and deriving realistic baseline limits. This is explored in Case Study 3.5.
Despite the overall improvements there are still substances, either in their original state or as breakdown products, that enter saline waters where their fate may not be fully understood. Even the contaminants that are present in seabed sediments have the potential to cause biological harm either by contact with bottom living fauna or by their ingestion of sediment. Our latest regulatory protocols put more emphasis on the need to investigate the potential to cause harm of all new substances before they are released into the natural world. There is an enormous range of substances used in modern industry and new ones coming on line all the time. Very few of the existing chemicals already in use have been properly assessed for risk associated with their release into the marine environment. Trace synthetic substances have no natural background level and many are now becoming detectable in deeper water and even in the polar ice caps.
These observations have led to the discovery of mechanisms such as global distillation and demonstrate the interdependency of the seas with other nations and the folly of assuming the oceans have infinite dilution. Offshore the main sources of toxic substances (especially oil) are from the dumping or accidental release from ships, waste from oil or gas platforms and atmospheric deposition. Drill cuttings contaminated by oil are present only from historic discharges and, through better treatment processes, the oil in produced water has been reduced even though the volume of produced water has increased. FRS has carried out a study of the effects of hydrocarbon releases on two areas of the North Sea; the Fladen Ground and the East Shetland Basin and these form the basis of Case Study 3.6. Minor oil spills from ships at sea still continue although tanker disasters are thankfully becoming rare worldwide.
CASE STUDY 3.4 Persistent organic pollutants in Scottish harbour (common) seals
Persistent organic pollutants ( POPs) include a number of industrial chemicals such as PCBs and chlorinated pesticides. Some of these, such as dichloro diphenyl trichloroethane ( DDT) are known to have adverse health effects upon wildlife and man, and they have been found in very high levels in marine mammals, particularly seals. These compounds biomagnify through food chains and concentrate in the fats of seals. Because seals consume food from similar parts of the marine food chains to humans, changes of pollutant levels within seals may indicate possible contamination in the human food chain.
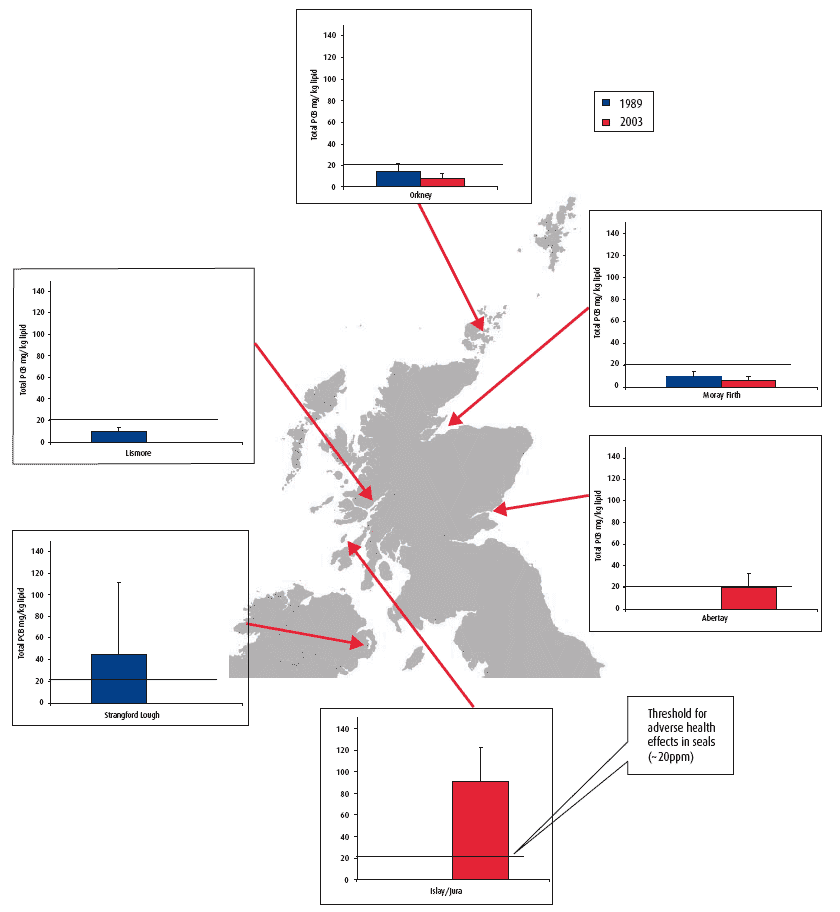
The PCBs in particular have been studied for their potential effect on vertebrate health and studies have found relationships with immune and reproductive dysfunction as well as thyroid activity (4). The reported threshold for potential adverse health effects in seals is estimated to be approximately 20 mg/kg (ppm) total PCBs in blubber on a lipid weight basis (5). Although the manufacture and use of PCBs and DDT in European countries have been banned for over 30 years, their legacy persists and POPs are present in harbour seals around the Scottish coast (Figure 3.5). The effects of PCBs on the immune system mean that there is a positive relationship between the severity of disease and the levels of PCBs in seals (6, 7).
Levels of PCBs in Scottish seals have declined over that last two decades (Figure 3.5). However, the most recent survey in 2003 found very high levels in seals captured at haul out sites in south-west Scotland, including in the Special Area of Conservation ( SAC) for this species on Islay. Indeed, all the adult males sampled had levels more than twice the threshold for likely effects (8). The relatively high level of PCBs in south-west Scottish waters may be due to food chain contamination emanating from POP usage in the Clyde where high PCB levels are also still found in the sediments (9). Although PCBs are no longer in use, newer persistent contaminants with similar structures and effects are taking their place. These include the polybrominated diphenyl ethers ( PBDEs) and hexabromocylcododecane ( HBCD) which have been used as flame retardants. While many of the PBDE compounds have now also been banned in Europe, HBCD is being used and is increasing in the blubber of UK marine mammals (10). PCBs remain a useful indicator of contamination and levels in seals correlate with the occurrence and uptake of the newer POPs including the PBDEs (Figure 3.6).
Summary
Seals tend to concentrate POPs across broad spatial scales in the marine environment and for parts of the food chain that are relevant to human health. Seals are also relatively easy to sample as indicators of trends. Across Scotland, results show that POP levels are at or below the threshold at which they are likely to have direct health effects, but in some cases the levels are well above those where an effect upon marine mammal health might be expected.
Figure 3.5 Geometric mean (± standard deviation) of total PCB concentrations in adult male harbour seals from around Scotland and Northern Ireland in 1989 and 2003
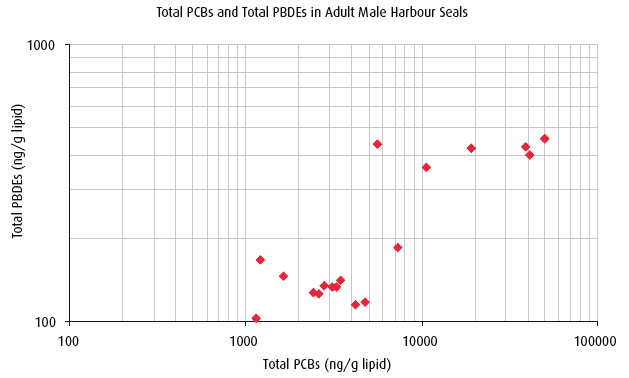
Figure 3.6 Relationship between total PCBs and total PBDEs in adult male harbour seals from Scotland
(Concentrations are calculated as Aroclor1254 equivalents for comparison with original data)
CASE STUDY 3.5 Geochemical analysis of sediment on the sea bed
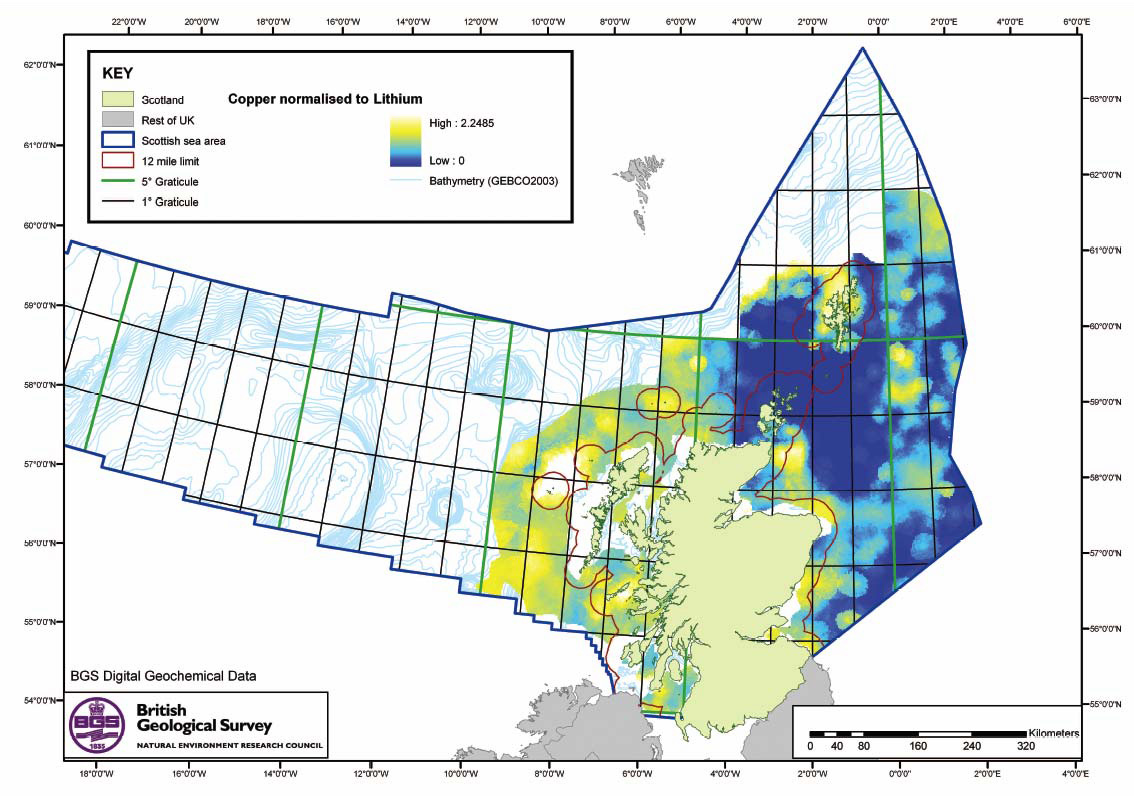
Approximately 5,000 samples of sediment collected by the British Geological Survey ( BGS) from the sea floor around Scotland have been analysed to measure their concentration of metals. Over 30 metals, including copper (Figure 3.7), lead, zinc and cadmium are available in the BGS database from which geochemical maps, statistical analysis and interpretation of the distribution patterns have been made in relation to the geology of the sea bed. As the samples were collected mainly during the 1970s and 1980s, they provide a useful baseline that predates much of the commercial activity that has taken place offshore of Scotland. In addition, there is a limited amount of inorganic geochemical data from selected estuaries and radioactivity measurements.
Naturally occurring concentrations of metals in seabed sediments are derived from the minerals, rock fragments and organic material (shell debris and vegetation) that comprise the sediments. They are the result of erosion of the underlying rocks or consolidated sediments (e.g. glacial deposits) or by weathering of rocks, soils and sediments on land. Sediment from land areas are supplied to the sea by rivers and winds or by erosion of coastal areas by wave action.
Contaminants entering the sea can also be derived from land by rivers and the atmosphere or from point sources such as ships or offshore installations. The contaminants follow the same processes of transport as naturally occurring metals, either in solution or held in suspension on the surface of fine-grained particles (see Chapter 2), although most contaminants show a stronger affinity for the latter. Much of this suspended material does not accumulate on the sea floor as it remains in the water column to be transported by currents over long distances. Where conditions are favourable, such as in areas with weak current strengths over bathymetric depressions on the sea bed, sediments may be deposited to form contaminant 'sinks'. Sediment grain-size, particularly the fine-grained component, is therefore an important factor in determining how sediments and metals are transported and deposited in the marine environment.
An important factor in the assessment of contaminant levels in seabed sediments is the establishment of 'background' concentrations. Background can be defined as the concentration that would be found in the environment in the absence of human activity. These values are often defined using, for example, the average abundance of metals in the Earth's crust, although these often do not reflect regional variations or the influence of marine processes. Local assessments of possible contaminants around Scotland using BGS data, which are indicators of the cleanliness of the seas, have produced a representative range of values that can be used to define background concentrations. BGS's shallow cores can also be used to record changes in geochemistry over time.
To further identify areas of the sea floor where metal accumulations are enriched above the concentrations that would be expected to occur naturally, a technique known as 'normalisation' is applied to the data. This method compensates for the influence of grain size on metal distribution to more easily identify areas influenced by human activity. The BGS data are normalised to the element lithium (Li), which not only represents grain-size variation but is also an important constituent of the minerals that make up Scotland's geological formations. Lithium also has the advantage of not being used to any great extent in manufacturing processes and therefore is unlikely to be present due to contamination. Once the grain-size affects have been removed, maps are produced that show areas where metal enrichment can not be explained by natural processes alone (Figure 3.7).
Summary Assessment
Parameter |
Geographical region |
Key factors & pressures |
What the evidence shows |
Trend |
Status now |
Confidence in assessment |
Reason for overall status |
|---|---|---|---|---|---|---|---|
Sediment quality/inorganic geochemistry |
All. Some in parts only. |
Input from wide range of human activities including commercial/industrial in both land areas and marine environment |
Hotspots of increased metal concentrations above naturally occurring background levels |
|
II |
Sufficient available for regional baseline assessment. Predates industrial activity during the last 20 years. Quality assured data. |
Figure 3.7 Distribution of copper around the Scottish coast (normalised to lithium)
CASE STUDY 3.6 The impact of the offshore oil and gas industry on the sediment of potentially accumulative areas of the North Sea
The North Sea has been the focus of offshore oil and gas production over the past 40 years and, as a result, hydrocarbons have been discharged to the area during drilling (via cuttings contaminated with oil-based drill muds), production (via produced water discharges) and via incomplete combustion during flaring operations. Hydrocarbon concentrations in the North Sea have been investigated over a number of years with the aim of assessing the impact of oil exploration and production and to confirm that increased regulatory control has resulted in a decrease in hydrocarbon contamination. FRS has concentrated on two areas of the North Sea; the Fladen Ground and the East Shetland Basin (Figure. 3.8).
A number of sediment surveys have been undertaken in these potentially accumulative areas (Table 3.4) which are also productive fishing areas; results from these samples are discussed below.
Figure 3.8 Locations of the Fladen Ground and the East Shetland Basin
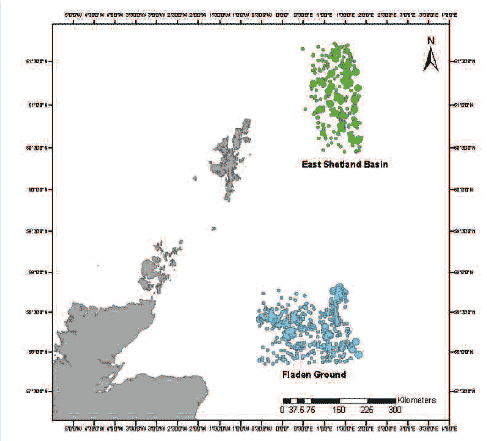
The distribution of oil platforms and single wells are also indicated in both areas.
Table 3.4 Details of the sediment surveys undertaken together with the number of samples analysed for oil equivalents and PAHs using both a systematic grid ( SG) and stratified random ( SR) approach
Year |
Fladen Ground |
East Shetland Basin |
||
|---|---|---|---|---|
Oil equivalents |
PAHs |
Oil equivalents |
PAHs |
|
1986 |
70 |
29 |
||
1988-89 |
79 |
75 |
||
1989 |
123 |
25 |
||
1994 |
72 |
0 |
||
2001 |
119( SG) |
119 ( SG) |
||
244( SR) |
244 ( SR) |
|||
2002 |
250 ( SR) |
250 ( SR) |
||
Survey design
Historically, sediment has been sampled using a systematic grid ( SG) approach involving several transects across each area being sampled at regular intervals. An alternative approach is the stratified random ( SR) survey; this allows a much simpler statistical analysis. In the latter approach, which has been used more recently (Table 3.4), sediment samples are collected at random, with the number of samples per stratum being proportional to the far field area, defined as those areas greater than 5 km from an oil platform and 2 km from a single well. Near field is defined as less than 5 km from an oil platform or 2 km from a single well.
Samples from the historical and recent surveys (Table 3.4) were screened for hydrocarbons by ultraviolet fluorescence ( UVF) to give estimates of total hydrocarbon concentrations expressed as crude oil equivalents. Samples were then selected for more detailed analysis.
Temporal trends in hydrocarbon concentrations
Near field Forties oil equivalent concentrations determined in pre-2000 surveys of both the Fladen Ground (Figure 3.9) and East Shetland Basin (Figure 3.10) were all above background (< 50 µg/g dry weight). Mean Forties oil equivalent concentrations in the far field were lower than in the near field in both areas. The Forties oil equivalent concentrations in sediments collected from the Fladen Ground in 2001 were significantly lower compared to 1989. Both the 2001 near field and far field sediment (systematic grid and stratified random sampling) were below background. Furthermore, 2001 near field sites gave lower concentrations than found in the far field in 1989. East Shetland Basin near field sediments have shown a progressive decrease in mean Forties oil equivalent concentrations with time while in the far field, mean concentrations were above background in both 1986 and 1989 but by 1994 showed a significant decrease (Figure 3.9 and Figure 3.10). The mean oil equivalent concentration determined following the 2002 SR survey was < 50 µg/g dry weight.
Figure 3.9 Mean Forties oil equivalents and total PAH concentration in the Fladen Ground
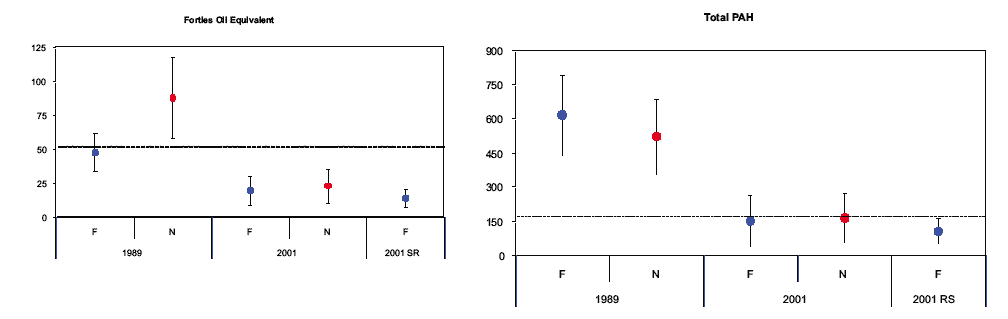
Interval plot showing the mean Forties oil equivalents (µg/g dry weight) and total PAH concentrations (µg/kg dry weight) in the Fladen Ground in 1989 (systematic grid ( SG)) and 2001 ( SG and stratified random ( SR)). Samples from both the near (N, red symbol) and far (F, blue symbol) field were analysed for the grid surveys. Dotted line = assumed background level.
Figure 3.10 Mean Forties oil equivalents and total PAH concentrations in the East Shetland Basin
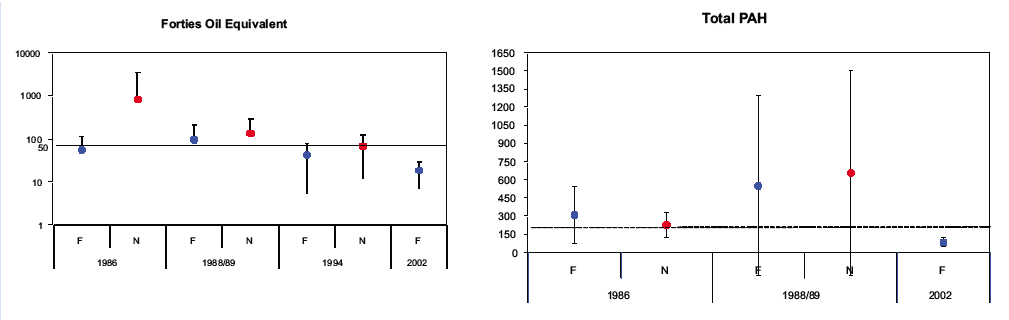
Interval plots of mean Forties oil equivalents (µg/g dry weight) and total PAH concentrations (µg/kg dry weight) in sediment from the East Shetland Basin surveys in both near (N, red symbol) and far (F, blue symbol) field samples.
Fladen Ground sediment PAH concentrations determined following the 2001 SG and SR surveys were generally low (< 150 µg/kg dry weight) and were greatly reduced relative to 1989. In the East Shetland Basin, the 2002 SR survey returned a mean PAH concentration below 150 µg/kg dry weight. In both areas, the PAH distribution profile, and concentration ratios, indicated a predominantly pyrolytic (from combustion), as against petrogenic (from oil), input. In the East Shetland Basin there was some evidence of petrogenic input, but this was of mixed North Sea and Middle Eastern origin. This is typical of input from shipping activity.
Conclusion
Hydrocarbon concentrations in both the Fladen Ground and East Shetland Basin in 2001 and 2002 can be classed as low or close to background. Furthermore, significant decreases in hydrocarbon concentrations were observed when compared to earlier surveys, it is probable that many will have degraded.
Summary Assessment
Parameter |
Geographical region |
Key factors & pressures |
What the evidence shows |
Trend |
Status now |
Confidence in assessment |
Reason for overall status |
|---|---|---|---|---|---|---|---|
Sediment quality |
Fladen and East Shetland |
Offshore oil and gas industry |
Reduction in hydrocarbon concentrations |
|
III |
Sufficient available, quality assured data |
Monitoring
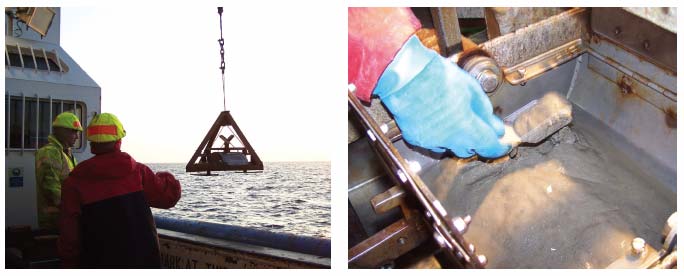
FRS and SEPA undertake monitoring targeted on understanding the sources of pollutant but they also participate jointly in the UKMMAS Clean Safe seas Environmental Monitoring Programme ( CSEMP) (11). Samples are taken from biota, water and sediments (Figures 3.11 and 3.12) to analyse for metals, PCBs, organochlorine pesticides ( OCPs), PAHs (both parent and alkylated) and, more recently, PBDEs. Integrated with these chemical analyses are a series of biological effects tests to provide a comprehensive assessment of environmental health. The programme fulfils the UK's commitment to European Directives and its mandatory monitoring requirements under the OSPARJAMP.
Figure 3.11 Sampling seabed sediments from the FRV Scotia by FRS as part of the CSEMP Programme
The general aims of CSEMP are to:
- support consistent standards in national and international monitoring programmes for marine environmental quality;
- establish appropriate protective regulatory measures;
- coordinate and optimise marine monitoring in the UK;
- provide a high quality chemical and biological data set from the UK's marine environment; and
- detect long-term spatial and temporal trends in physical, biological and chemical variables at selected estuarine and coastal sites.
To ensure the precision and validity of results produced, all organisations contributing to CSEMP are required to demonstrate a high standard of biological and chemical analytical quality control and to participate in intercalibration testing.
It is important that the level of contaminants accumulated in living things alone is not measured but that the effects of these substances in the survivability and health of the population involved is investigated since, even the contaminants that are present in seabed sediments have the potential to cause biological harm either by contact with bottom living fauna or by their ingestion of sediment. Biological effects testing is used by FRS, SEPA and the academic community (e.g. Glasgow Caledonian University) especially where there are little data available on the effects of a contaminant on living systems. Such testing can yield subtle results that may demonstrate effects in terms of behaviour, cell development or physiology. As an example there are increasing concerns about endocrine disrupting substances and plasticisers such as diethylhexylphthalate ( DEHP) which are present even in some treated sewage effluents. Most of the new threats now come from synthetic substances, such as pharmaceuticals. They may be knowingly released into the sea, as when drugs are used under carefully prescribed conditions to treat farmed fish or conversely have unintentional pathways into marine waters via sewage or freshwater run-off as in the case of 17ß-oestradiol (arising from the female contraceptive pill). Traditionally, biological effects measurements have utilised the likes of enzyme activity, concentrations of metabolites or the incidence of externally visible fish diseases. However, more recently there has been an attempt to utilise a genomics approach as illustrated in Case Study 3.7.
Monitoring pollution in the seas is vital but to ensure we have intelligently managed improvements, regulators and politicians must be aware of what is going into the sea and whether there are any significant trends or particular hotspots. To ensure transparency of information SEPA makes all discharge information available in a Web based format outlined in Case Study 3.8. This allows anyone to access information on licensed release of chemicals to all waters including saline ones.
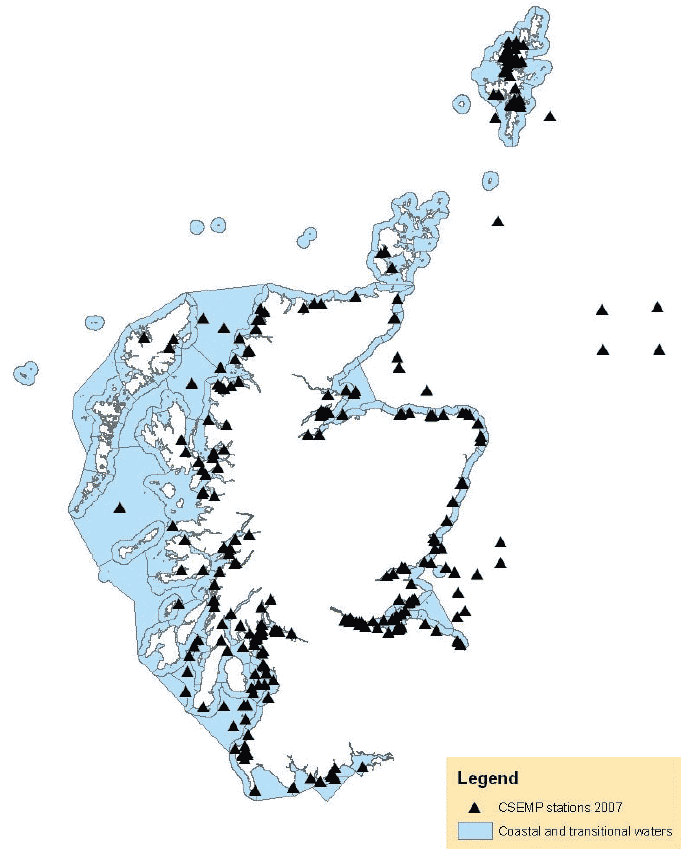
Figure 3.12 Scottish CSEMP sampling sites
CASE STUDY 3.7 Evaluating the effects of environmental stressors on marine wildlife - Emerging techniques and approaches: DNA microarrays and qPCR arrays
Current biomarkers of environmental stress
Biomarkers provide an indication of the exposure of wildlife to environmental stressors such as exposure to hazardous substances and increasing sea temperatures. Current practice is to assess the altered status of a biological parameter such as an enzyme activity or level of expression (e.g. CYP450) comparing animals from impacted or altered locations to those at locations believed to be unaffected by stressors. Increased expression of CYP450 indicates exposure to, for example, PAH and highlights the potential for adverse effects such as cancer resulting from the exposure. Recent practice does not rely on measurement of a single biomarker but incorporates a suite of measurements. For instance where PAH pollution is suspected (e.g. in the vicinity of oil platforms, oil terminals, harbours) CYP measurement may be combined with measurements of conjugated bile products and induction of other enzymes such as glutathione-S-transferase and UDP-glucuronosyltransferase. Although this approach broadens the data collection it is sampling only a very small proportion of the biological response and has limited power to predict higher order consequences affecting health or reproductive capacity.
DNA microarrays and qPCR arrays
Techniques developed during the Human Genome Project allow the parallel measurement of thousands of biomarkers in single biological samples. DNA microarrays consist of glass slides on which minute deposits of specific DNA sequences have been printed in a regular matrix (Figure 3.13). Each deposit represents a distinct gene, and is used to measure the level of expression of that gene, and each array has tens of thousands of such deposits. In principle arrays can measure the expression level of every gene in a tissue. Microarrays were originally applied in the area of medicine and enabled the identification of genes whose expression differed between diseased and normal tissue. Other studies investigated the effects of drugs on mammals and found that typically the expression of 50-100 genes would be altered. More recently, microarrays have been used in an environmental context and two types of study have been conducted. The first is where the effect of a stressor is assessed under laboratory conditions while in the second type animals from the environment are profiled. An example of the former type of study includes work conducted by Glasgow Caledonian University, FRS and SEPA which used an array to study the effects of ethinyl oestradiol on plaice. The very first published report of an environmental application used a microarray jointly developed by the University of Stirling and the University of Birmingham and analysed flounder from two UK locations. Arrays are also under development for invertebrates. Recently an array for mussel has been used to evaluate environmental status of mussel on the west coast of Scotland in work conducted by Glasgow Caledonian University and SEPA. The outputs of array studies provide a wealth of novel data that identifies both general and specific stress responses and these hold the prospect of being diagnostic of both exposure and of potential adverse effects in the future. However, environmental applications of genomic approaches have been limited by the lack of genomic resources (e.g. sequence data, cloned genes) for sentinel species. This problem is becoming less problematic as the number of genome projects increase and with the wider application of the revolutionary approach to sequencing with the ultra-high throughput DNA sequencing systems available today providing a plethora of data on diverse organisms.
There is continuing activity in Scotland in the development of arrays and their application to establishing the state of the marine environment. A consortium consisting of the University of Stirling, Glasgow Caledonian University, FRS, University of Birmingham, University of Exeter and CEFAS are investigating adaptation in fish to stressors using the previously described flounder array and a newly developed stickleback array (Figure 3.13). This Ecotoxicogenomics project is reaching its conclusion and results of laboratory and environmental studies are currently being analysed. It should be noted that the volume of data generated by array experiments is large and dedicated Bioinformatic Scientists are now required to analyse and interpret the data.
In addition to arrays for wildlife others have focussed on applications relevant to aquaculture in the marine environment. The TRAITS project is a collaboration between the Universities of Stirling, Aberdeen and Cardiff, the Roslin Institute and the Norwegian School of Veterinary Science. Project objectives are to identify the genetic basis of commercially important traits in salmon and to develop DNA microarrays to monitor indicators of health and performance. The project has developed a salmon array with 17k spots and results of its use are just appearing in the literature. The University of Aberdeen is also in the process of developing an array for the rainbow trout.
Microarrays are essentially discovery tools and in their current form are unsuitable for routine environmental use. Array experimentation is technically demanding and, as alluded to earlier, the data-analysis process is far from simple. There is a deficit of skilled staff for experimentation and subsequent bioinformatics. However, microarrays are hugely informative in facilitating an alternative method of gene biomarker determination.
Quantitative, Real-time PCR ( qPCR) has been introduced over the last decade as a means of measuring biomarker (gene) levels. The method uses fluorescent reagents to follow the progress of PCR reactions on a continuous basis. Equipment for this technique is based on the use of 96 well microtitre plates, every well of which can be optically scanned for fluorescence as individual reactions proceed. The use of qPCR arrays has been pioneered in the medical field and targeted arrays (e.g. drug metabolism, oxidative stress, apoptosis) are commercially available for use on humans (SuperArray). Thus microarray studies lead to the discovery of genes whose expression is altered by exposure to a particular stressor and which will be informative on exposure and effect. This allows the development of a targeted qPCR array. qPCR provides a robust technology and in an array format can achieve the same as a macroarray measuring multiple transcripts simultaneously in a single biological sample.
At the time of writing, qPCR arrays are under development at the University of Stirling for flounder for work in collaboration with FRS and at Glasgow Caledonian University for plaice again in collaboration with FRS. A bigger study is about to start in which Glasgow Caledonian University is collaborating with SEPA (East Kilbride) in a Knowledge Transfer project that will develop and evaluate qPCR arrays for stickleback and mussel. Each of these developments is made possible by knowledge gained through array experiments in the projects indicated above.
Conclusion
The application of genomics techniques in environmental studies is in its infancy but is developing rapidly. This summary has only addressed DNA-based techniques but the other 'omics' such as proteomics and metabolomics are likely to be relevant to environmental monitoring in the foreseeable future. In an attempt to share experience, avoid duplication of effort and to agree on international standards the UK ( NERC) is funding a national and international Knowledge Transfer projects to consider 'omics' applications in the environment. Partners in these projects include the University of Stirling, Glasgow Caledonian University and FRS. Thus Scotland is well placed to take advantage of the huge benefits resulting from the applications of 'omics' approaches in terms of expertise, resources and global involvement.
Figure 3.13 Microarray data

The figure shows microarray data generated by the NERC-funded Ecotoxicology Consortium from an experiment in which stickleback were exposed to increasing concentrations of dibenzanthracene ( DBA). The image on the left shows a portion of a microarray used to test a single sample. Each dot represents an individual DNA sequence and the computer-generated colours indicate if the gene for that sequence has increased (red), decreased (green) or unaltered (yellow) expression relative to an untreated animal. The image on the right is a 'heat map' that summarises data from multiple microarrays. Each row represents an individual gene and each column a separate microarray test sample with animals exposed to increasing DBA from left to right. The colour coding of the 'heat map' indicates if expression increases (red) or decreases (blue) relative to untreated animals.
CASE STUDY 3.8 Scottish Pollutant Release Inventory ( SPRI)
The Scottish Pollutant Release Inventory ( SPRI) is a publicly accessible electronic database of releases of pollutants to air, water and land from licensed sources. Many of the discharges are to estuarine or coastal waters, and knowledge of these discharges is helpful in understanding the state of Scotland's marine environment. The SPRI can be accessed via the SEPA web site (12). Its aims are to:
- provide data and information to the public and so help facilitate discussion and public participation in environmental issues and decision making;
- provide data and information for policy makers and academics;
- provide information on pollutants to support on-going work to prevent and reduce pollution caused by these substances;
- allow comparison of releases of substances by industry sector; and
- deliver the system by which Scotland will comply with the requirements of an EU Regulation on the implementation of a European Pollutant Release and Transfer Register.
SPRI dischargers are asked to supply information on their total emissions to air or to water as kilograms per year. There are threshold values below which emissions do not need to be reported. The SPRI currently contains information for pollutant releases for 2002, 2004, 2005 and 2006.
Types of site which report information to the SPRI
Sites reporting to the SPRI include:
- processes covered by the Pollution Prevention and Control Part A regulations - these include many industrial and manufacturing processes;
- sites covered by the Radioactive Substances Act Band A or Band B - these include nuclear power stations, hospitals and universities;
- waste water treatment works;
- waste management site such as industrial or municipal landfill sites; and
- marine caged fish farm sites.
Substances reported
There are six main sections in the form to be completed. Sections A, B and C require information on emissions to air, discharges to waters and releases to land respectively. These are supplied for individual compounds within each of the broad groupings of:
- inorganics
- organics
- radionuclides
- metals and compounds
- other pollutant groups
These groupings include a total of 129 substances for releases to air and 77 for releases to waters; for some substances, reporting is required to both media.
How to access the SPRI
To access the site see reference (12). Searches can then be undertaken by inserting a post code and a distance from it as a search range. Alternatively, the SPRI Emission Data can be accessed directly. If choosing this latter option, searches can be undertaken by postcode, by pollutant or by operator name.
For example, selecting by pollutant, the screen shown below (Figure 3.14) appears which asks for the search to be refined by year, by pollutant, by PPC Code or Industry Sector and by media. A choice is given to see release figures that are below the reporting thresholds for the pollutant selected.
Figure 3.14 Sample of SPRI web page screen
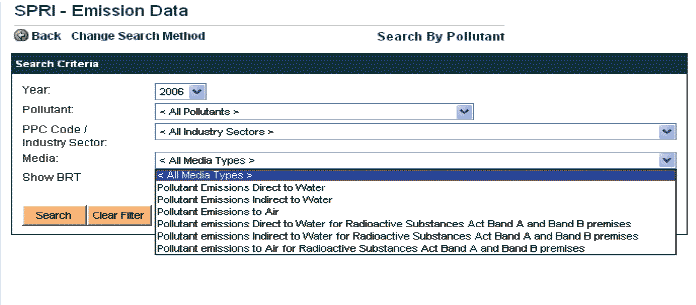
The SPRI information is presented as a list of companies in alphabetical order. You can then select to view the data supplied by the company and/or to see the location of the company selected on a map.
Nutrient inputs and eutrophication
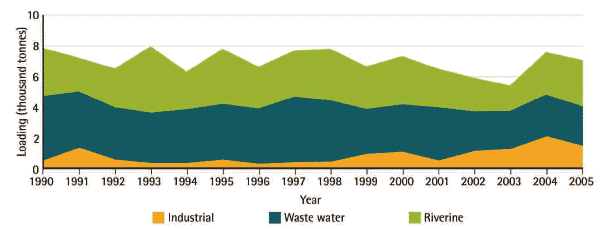
The key nutrient in saline waters is normally nitrogen, as this is usually the element limiting the growth of algal blooms. Despite obligations under OSPAR to reduce the input of nutrients, the input of inorganic nitrogen and phosphorous compounds is an example where less success has been achieved in reducing discharges so that loadings have hardly changed in the last 15 years (13) (Figures 3.15 and 3.16).
For Scotland, sewage is a smaller source of nitrogen inputs to the sea than farming, so the implementation of secondary sewage treatment as required by the Urban Waste Water Treatment Directive, has had little influence on the total inorganic load of nutrients that are discharged. Fortunately despite this lack of progress, only a couple of small local areas of the Scottish marine environment are deemed eutrophic and this is explored in more detail in Case Study 3.9.
Nitrogen concentrations in the Firths of Clyde and Forth are elevated above background levels due to their catchments serving high population numbers. However, perhaps surprisingly, more significant concentrations are found in the estuaries of the South Esk and Ythan rivers, where the nitrogen arises mainly from agriculture. Where waters are seen to be at risk, catchment areas may be subject to nitrogen restrictions for farming (nitrogen vulnerable zone) or tertiary treatment for sewage (the removal of nitrogen or phosphorus). Nutrients naturally cycle in the sea and the upwelling of deep, naturally nutrient rich water along the coastal shelf edge is essential for supporting healthy fisheries. Significant shifts in the biomass of phytoplankton is observed in long term data sets collected offshore by continuous plankton recorders towed behind ships. These changes appear to arise from climatic change (sea warming) and trends in the North Atlantic Index, rather than any change in nutrient fluxes. Scotland's requirement to carry out regular eutrophication assessments for OSPAR are expanded in Case Study 3.9.
Figure 3.15 Total nitrogen loadings from industry, rivers and sewage treatment works to the Scottish marine environment, 1990-2005
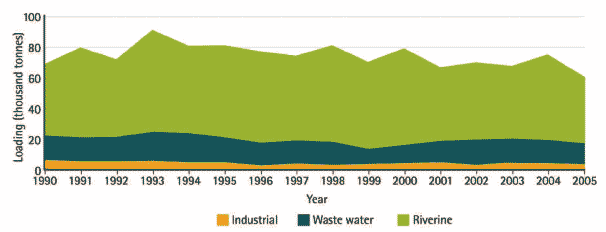
Figure 3.16 Phosphorus loadings from industry, rivers and sewage treatment works to the Scottish marine environment, 1990-2005
CASE STUDY 3.9 Eutrophication in Scottish marine waters
What is eutrophication?
Eutrophication is the enrichment of water by nutrients, especially compounds of nitrogen and/or phosphorus. This causes an accelerated growth of algae and higher forms of plant life, producing an undesirable disturbance to the balance of organisms present in the water and to the quality of the water concerned. Where eutrophication is found, action is needed to restore the ecosystem to full health and ensure that the marine environment can be used sustainably.
How is eutrophication assessed?
Eutrophication is assessed using criteria set by the OSPAR Common Procedure (14) under which threshold values have been set for:
- causative factors, e.g. nutrient inputs and winter nutrient concentrations, particularly nitrate as this limits algal growth in marine waters;
- direct effects of nutrient enrichment, e.g. summer chlorophyll a levels;
- indirect effects of nutrient enrichment, e.g. oxygen deficiency; and
- other possible effects, e.g. shellfish poisoning.
What is the state of Scotland's marine waters in relation to eutrophication?
Most of Scotland's marine waters are not at risk of eutrophication, and are designated as non-problem areas. The Ythan Estuary in north-east Scotland, 20 km north of Aberdeen, was identified as a Problem Area ( PA). This was because the criteria for winter nutrient concentrations, N:P ratios and macroalgal coverage and biomass were exceeded. The South Esk Estuary, part of Montrose Basin, was identified as a Potential Problem Area ( PPA), due to high levels of macroalgal coverage and biomass. Although these sites have been classified in this way the ecosystems still appear healthy and human use is promoted. In Montrose Basin there are internationally important numbers of pink-footed geese, greylag geese and redshank, and nationally important numbers of shelduck, widgeon and eider, and a Visitor Centre and Wildlife Reserve run by the Scottish Wildlife Trust.
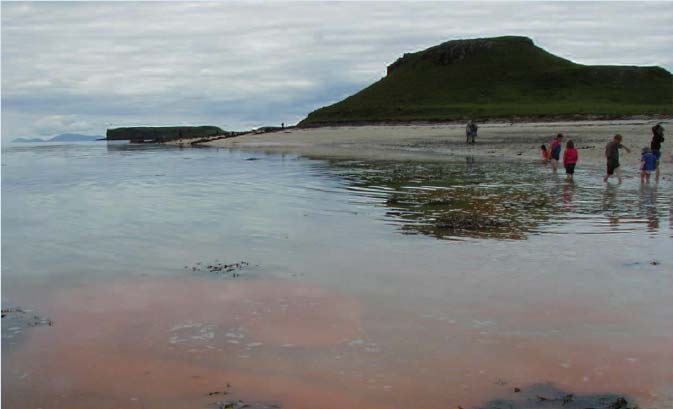
Occasional blooms of toxic or non toxic species may occur virtually anywhere for reasons that are not clear and certainly show little relationship with nutrient levels (Figure 3.17).
Figure 3.17 Red tide on a beach in Skye
How is water quality improved in the impacted areas?
Water quality is improved by identifying the reason for the eutrophication, implementing the relevant legislation and taking appropriate management action. The extensive macroalgal coverage in the Ythan and South Esk Estuaries was due to high loadings of nitrogen, mainly from agricultural sources.
The EU Nitrates Directive seeks to protect waters from pollution caused by nitrates. In 2000, these areas were identified as Nitrate Vulnerable Zones ( NVZs) under this Directive, and management measures in terms of improved agricultural practice taken to reduce diffuse inputs of nitrates and improve water quality.
The EU Urban Waste Water Treatment Directive ( UWWTD) sets measures to protect the marine environment from the adverse effects of insufficiently treated urban waste water (sewage) discharges. This Directive also requires regular assessment of eutrophication status in a similar way to OSPAR but eutrophic areas are called sensitive waters. Failure of these assessments lead to statutory requirements for improvements.
A note on geographical regions
In Chapter 1, the recently agreed reporting regions are outlined. These include large Regional Sea Areas, and the smaller Water Framework Directive water bodies, the latter having to be reported on for their eutrophication status. These eutrophication assessments describe specific sea areas intermediate in size between these, typically estuaries or coastal waters. These are the geographical regions described in the Summary Assessment.
Summary Assessment
Parameter |
Geographical region |
Key factors & pressures |
What the evidence shows |
Trend |
Status now |
Confidence in assessment |
Reason for overall status |
|---|---|---|---|---|---|---|---|
Eutrophication status |
Solway Firth, Clyde, Tay, Eden & Forth Estuaries, Firth of Clyde |
Nutrients mainly from rivers and sewage works |
Chlorophyll values low and no secondary effects |
III |
Non-problem Areas |
||
Eutrophication status |
South Esk Estuary |
Nutrients mainly from rivers |
Inputs vary with river flow; chlorophyll low; macroalgae cover and biomass exceed criteria |
III |
Potential Problem Area |
||
Eutrophication status |
Ythan Estuary |
Nutrients mainly from rivers |
Inputs vary with river flow; chlorphyll moderate to high; macroalgae cover and biomass exceed criteria but are reducing |
|
III |
Problem Area |
Radioactive substances
Radioactive substances, though treated separately by regulation, become distributed in the environment in the same way as any other substance depending on its stability and solubility even though the manner in which they have the potential to cause environmental harm is different. Some radioactive substances, though discharged at very low levels, have half lives of hundreds or even hundreds of thousands of years. Radioactive substances are used in industry for a variety of applications, for example in medicine, nuclear powered submarines and food preservation. These applications result in discharges and emissions of radioactivity into the environment. Radioactivity is also naturally present in the environment, for example in rocks and sediments.
SEPA controls the amount of radioactive wastes that industry is allowed to discharge to the environment. A continual and comprehensive monitoring programme, which includes sampling of a variety of media such as seaweed, water, grass and a large range of seafood and locally grown produce, is undertaken by SEPA.
By researching the people that live in the vicinity of nuclear licensed sites, understanding their habits and what food they eat, the regulator can undertake an assessment of the impact of the discharges to the most exposed individuals to ensure that legal limits of exposure are not breached.
Details of some of the monitoring are explored in Case Study 3.10. The data analysis in this case study did not include sites of known localised contamination, for example at Dalgety Bay, Chapelcross and Dounreay. These sites are subject to a different monitoring strategy and are not suitable for assessing trends in the marine environment but are discussed below.
Inputs of radionuclides into the environment from Dounreay
Following the discovery of 34 fragments of irradiated nuclear fuel on the seabed near Dounreay in 1997, an order was made under the Food and Environment Protection Act 1985 to ban the harvesting of seafood within a 2 km radius of the discharge pipeline. Regular annual monitoring of Sandside Bay and the Dounreay foreshore has led to the discovery and removal of radioactive particles from these areas. In 2005 a radioactive particle was also found at Dunnet beach. Limited offshore monitoring has also detected hundreds of particles in the marine environment. The particles originate from the historic activities at the Dounreay plant.
A comprehensive scientific assessment showed that the overall current risk of a member of the public encountering a particle on public beaches at Sandside was low.
The Dounreay Particles Advisory Group ( DPAG) was set up in 2000 (15).
Radioactive contamination at other sites in Scotland
At Dalgety Bay in Fife radium 226 contamination was first detected in 1990. It is believed to have originated from salvage work involving radium-coated instrumentation at a former military airfield at Dalgety Bay. Some contaminated material has been removed. Although the most recent assessment of the radiological risk showed that there was a realistic chance of encounter, the potential effects on health were considered to be low. It also suggested that further investigation of the extent of the contamination is warranted.
Monitoring in July 2005 confirmed the presence of radioactivity in an area of Aberdeen beach near the harbour. Sampling and analysis has been undertaken to identify potential sources of the radioactivity. Radiation exposure received by members of the public using the beach regularly was negligible.
Some of the nuclear installations in Scotland are approaching the end of their useful operating life and radioactive waste associated with their decommissioning will have to be managed in the future. Accumulations of intermediate and high-level radioactive waste, already stored at some nuclear installations in Scotland, present particularly challenging issues for ensuring safe, long-term disposal (16).
CASE STUDY 3.10 Radioactive substances
Introduction
SEPA is responsible for regulating the keeping, use and, if necessary, the disposal of radioactive waste from offshore installations, hospitals, universities and research premises. SEPA also grants authorisations for the disposal of radioactive waste from nuclear licensed sites in Scotland. These permits minimise the impact on human health and the environment by the use of radioactive material and any disposal of radioactive waste The primary objective of protecting human health is achieved through SEPA's legal powers under the Radioactive Substances Act 1993 ( RSA 93) and other legal instruments.
SEPA also monitors environmental radioactivity in coastal waters to assess the impacts of these authorised discharges of radioactive wastes. This report summarises monitoring data for 1997-2006. SEPA's environmental radioactivity monitoring programme provides the data needed to assess the detriment (dose) incurred by the most affected members of the public from authorised disposals of radioactive waste. These critical groups are people who, because of what they eat and what they do (work and pastimes), are more likely to have greater exposure than other groups of people. Because of the large numbers of pathways by which radioactive sources can be encountered, it is possible to have more than one critical group per source.
Major sources of radioactivity in Scotland's marine environment
The major components of man-made (anthropogenic) radioactivity in the marine environment arise from the discharges from nuclear licensed sites and the non-nuclear industry. Discharges from nuclear licensed sites have continued to show a decreasing trend, due to operator process improvements and regulatory involvement. The following list details the key sources of discharges of radioactive waste in each UK maritime region.
Irish Sea
Sellafield, Cumbria:
Situated on the Cumbrian coastline, only a few miles from the Scottish border, Sellafield is the largest nuclear site in the United Kingdom. The regulation of the release of radioactive substances from this site is carried out by the Environment Agency. However, due to the nature of Sellafield discharges, SEPA carries out a programme of environmental monitoring to assess the impact of these discharges on Scotland.
Chapelcross, Dumfries & Galloway:
Located within four miles of the Solway Estuary, Chapelcross is a four-reactor station with eight 30 MW turbines. This station ceased electricity power production in 2004 and is now undergoing decommissioning.
Clyde
Hunterston A & B Stations, Ayrshire:
Situated near West Kilbride on the Hunterston Peninsula of the Ayrshire coast.
Hunterston A
Powered by twin Magnox reactors, Hunterston A ceased electricity power production at the end of March 1990 and is undergoing decommissioning.
Hunterston B
Powered by a pair of Advanced Gas-cooled Reactors, Hunterston B, currently operating at a reduced level of 70% maximum output, is capable of supplying power to over 1 million homes.
HMNB Clyde, Firth of Clyde:
Her Majesty's Naval Base ( HMNB) Clyde establishment consists of the naval base at Faslane and the arms depot at Coulport.
Babcock Naval Services, a subsidiary of Babcock Support Services Limited, operates at HMNB Clyde in partnership with the Ministry of Defence (MoD). However, the MoD is responsible for the disposal of radioactive waste.
North Scotland Coast
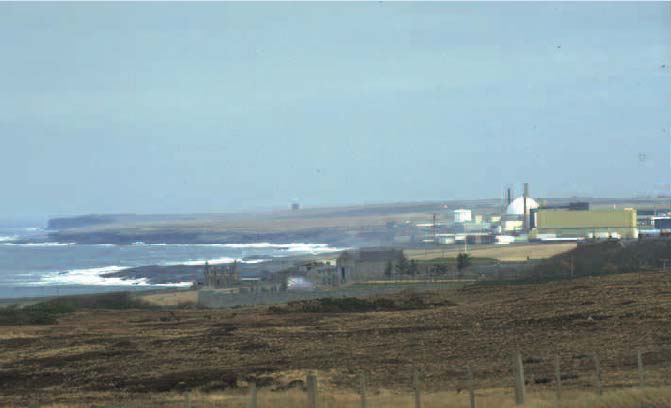
UKAEA Dounreay & Vulcan NRTE, Caithness:
Dounreay (Figure 3.18) was once Britain's centre for fast reactor research and development. Now the 140-acre site in Caithness is the largest nuclear decommissioning project in Scotland and the second largest nuclear licensed site in the UK after Sellafield. It is planned that Dounreay will be fully decommissioned by 2033.
The Vulcan Nuclear Reactor Test Establishment, operated by the MoD (Procurement Executive), is located adjacent to the UKAEA site, and the impact of its discharges is considered along with those from Dounreay.
Forth
Torness Station:
Situated on the east coast, near Dunbar, Torness power station has been in operation since 1988. It is powered by two Advanced Gas-cooled Reactors and, with an electrical output of 1250 MW, is capable of supplying power to over 1.5 million homes.
Rosyth Royal Dockyard:
Decommissioning of Rosyth Royal Dockyard in Fife commenced in 2003 following the final refit operations on two Royal Navy nuclear submarines. In addition to carrying out the yard's own clean-up operations, seven of the Royal Navy's eleven decommissioned nuclear submarines are currently stored at Rosyth.
SEPA's marine environmental radioactivity monitoring programme includes analysis of seawater, sediments, seaweed and seafood (fish, crustaceans). As the availability of fish and shellfish samples varies significantly across Scotland there is difficulty in directly comparing the regions against each other. However, overall analysis of monitoring data showed that generally there were no statistical trends and that, importantly, many of the results were at the limits of detection for the radionuclide of concern (i.e. no positive result). The limit of detection will vary for each radionuclide and is dependant on sample size, which can vary due to the availability of marine species (particularly seafood).
Annually, a summary of the results of SEPA's marine and terrestrial programmes is published in Radioactivity in Food and the Environment ( RIFE) reports (17). The reports include an assessment of the impact of discharges on various critical groups.
Figure 3.18 Dounreay fast reactor site in Caithness, north Scotland
Summary Assessment
Parameter |
Geographical region |
Key factors & pressures |
What the evidence shows |
Trend |
Status now |
Confidence in assessment |
Reason for overall status |
|---|---|---|---|---|---|---|---|
Radioactive Substances |
Sampling locations around Scottish coast |
Industrial use especially power generation |
Low concentrations (most samples below the limit of detection) and no discernible trend |
II |
No evidence of risk to human health or the environment at the RIFE sites |
Radioactivity beyond 12 nautical miles
Monitoring in deeper waters outside of 12 nm is carried out by Cefas and is reported at a UK level as part of the commitment under the OSPAR Radioactive Substances strategy. Particular attention was paid to caesium 137, the bulk of which stems from historic discharges from Sellafield in Cumbria going back to the 1970s. Although these levels have dramatically fallen with time, concentrations measured off the west coast of Scotland were still around one hundred times higher than the global fallout level found in North Atlantic surface waters (18).
Naturally occurring radionuclides, principally uranium 238 and thorium 232, are disturbed when the Earth's crust is drilled to extract oil and gas. They are found around oil and gas platforms and from the scaling removal of equipment brought ashore. The levels are low and even though this waste is not considered to be a hazard, strategies are in place to reduce the amount of waste produced and re-inject as much as possible into the drilled strata (19). Predictions show a further steady reduction expected over the next 15 years.
Temperature and noise
Changes in temperature and the creation of artificial noise are two of the most prevalent forms of man derived energy entering the marine environment. Temperature changes can either be hot or cold and are of significance where this is a large difference between the discharged water and the receiving water. Mixing ensures that the area affected is relatively small but can be problematic if it is a narrow estuary with restricted circulation. Hot water is principally found in cooling water from, e.g. power stations or process water, e.g. from distilleries. Standards are still to be decided under WFD but no discharge in Scotland is considered to have more than a small local effect.
Noise is very much a product of the last hundred years and comes from diverse sources such as military activities, shipping, seismic exploration and renewable energy structures. There is little information on the effect of noise on invertebrates, some on fish but the greatest concern is on the disturbance to marine mammals many of which rely on sonar for communication (20). Some human derived sound, especially from electronic sonar devices, can travel large distances on water. Steps are now being taken to control unnecessary noise so that in the case of seismic surveys JNCC is consulted in every case and has guidelines to cover noise but there are few situations that are unique to Scottish waters.
Litter and waste
Litter (Figure 3.19) visibly demonstrates the interconnectivity of the seas as even remote beaches far from any centres of human habitation may still have heavy deposits of litter, and discarded waste can be found in the open sea either floating on the surface or sunken to the sea bed depending on its buoyancy. Surveys of both the public and scientist's opinion show a continuing concern about litter and rubbish in the seas and on shorelines. It causes both ecological harm and an aesthetic eyesore.
Figure 3.19 Beach litter at Helensburgh
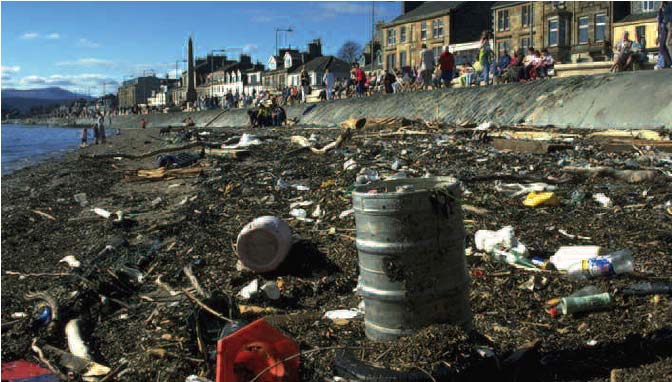
Marine litter has been an ongoing problem for many years and arises from a number of sources including wilful discharge by individuals, fly-tipping and dumping from vessels. Some waste may also arise from accidents, as seen in the south coast of England in 2007 in relation to the grounding of the Napoli, or unintentional carelessness. The litter in Scottish seas may be derived locally, or have travelled thousands of miles, from well outside Scotland's direct influence. Some sea lochs act as natural collecting funnels when facing prevailing winds, e.g. the Head of Loch Long at Arrochar in the Clyde Sea area collects large accumulations of litter on the beach even though the local population is very small.
Many surveys have described the problem so that we know that about 80% of marine litter originates from land and up to 90% of the waste consists of plastics which may persist for considerable periods of time (21). Litter is not only unsightly but large items can strangle animals and small pieces can be ingested by animals sometimes with fatal consequences. Litter has an economic cost in blocking water intakes, getting wrapped round boats propellers or simply the cost of physically removing it from beaches. However, controlling the entry of litter into the environment has proved far more difficult as it originates from so many sources. Education, a general move to reduce packaging and a change to biodegradable materials will all help but the solution does not lie with any agency or even one country. There is no evidence marine litter has declined over the last 20 years and it may still be on the rise.
Bacterial contamination
Faecal bacteria originate from human sewage and from animal faeces principally washed into burns from farmland in wet weather. Their presence is monitored via indicator species present in all warm-blooded species, rather than disease causing bacteria themselves which are only present when in large numbers when there is an infection in the source community. Both indicator and pathogenic bacteria have a limited survival rate in saline waters, but if sewage treatment and dispersion are inadequate they may be present at levels high enough to cause illness or infections in humans bathing or in contact with the receiving water. There were 61 EU recognised bathing waters around Scotland's coast in 2006, and it is SEPA's task to ensure that they all meet EU bacterial standards. There has been a significant overall reduction in average bacterial counts over the last 10 years and all identified bathing waters met the EU standards for the first time in 2006. Wet weather remains an influence on bacterial levels as high rainfall inevitably washes more bacteria from pasture land. The 100% record was not maintained in 2007 as the wetter summer led to increased run-off from diffuse rural and urban sources (Figure 3.20). The general reduction in measured faecal coliforms is a result of better sewage treatment, more effective discharge locations and targeted farm inspections and improvement plans.
Shellfish are also monitored for their bacteriological concentration under two EC Directives. SEPA monitors shellfish as part of their assessment of the quality of waters in which shellfish live for the Shellfish Waters Directive 79/923/ EEC. The FSAS monitors shellfish to ensure they are safe to go to market for human consumption under EC legislation including EC 2073/2005, EC 2074/2005, EC 852/2004, EC853/2004 and EC 854/2004 (see Case Study 5.1). Under this legislation shellfish production areas are classified as shown in Figure 3.21 but any particular site may have more than one classification for the same production area depending on the time of year.
Figure 3.20 Annual average faecal coliform concentration for all samples from the 60 continuously designated EU bathing waters: 2000-2007
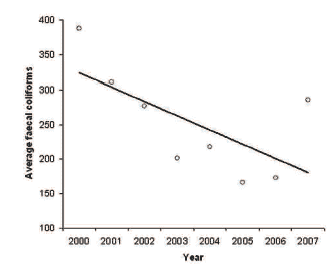
(Where three waters were no longer monitored during 2007 concentrations were taken at the 2006 level)
Figure 3.21 Classification of shellfish production areas
Production areas are grouped into four different categories: |
||
|---|---|---|
Category A |
Less than 230 E.coli/100 g shellfish flesh |
May go for human consumption if End Product Standard * met |
Category B |
Less than 4,600 E.coli/100 g shellfish flesh in 90% of samples |
Must be depurated, heat treated or relayed to meet Category A requirement |
Category C |
Less than 46,000 E.coli/100 g shellfish flesh |
Must be relayed for long periods (at least two months) whether or not combined with purification, or after intensive purification to meet Category A or B |
More than 46,000 E.coli/100 g shellfish flesh |
Unsuitable for production |
|
* A requirement to be met before a product can be marketed |
||
The results of the classifications are of great significance to the financial viability of the producer. Although there is a general relationship between the amount of bacteria found in shellfish to concentrations found in the water column the relationship is not simple because some bacteria can survive or even multiply within some species of shellfish. This makes it difficult to come up with water standards that will guarantee resident shellfish meeting high classification standards. Where water quality improvements can be justified they will be actioned through the WFD.
WHAT GAPS ARE THERE IN OUR KNOWLEDGE?
Inevitably our knowledge of what is clean and safe comes from monitoring data which generally are collected on a risk assessed based approach, i.e. the greatest attention is given to areas where problems are already confirmed or at least likely. The WFD and the new MSFD both challenge these assumptions and require monitoring even in areas assumed to be clean. Knowledge of deeper offshore waters is generally much poorer than the inshore coastal zone. Both SEPA and FRS have more recent programmes that are more wide ranging.
For radioactive substances there is little study on the effects of these substances on natural biological communities. The critical path and dose limit calculations for humans may not protect all marine species and more information is required. Much of the regulation that is linked to the measurement of eutrophication assumes a link between human derived nutrients and blooms. However, the sequential growth of marine phytoplantonic algae are still subject to large natural variations that have no known connection to human activities, including the occasional blooms of toxic algae.
As well as via ecosystem assessment methods, any potential adverse impacts of persistent pollutants on biota are monitored by bioaccumulation and biological effects assays. All approaches are needed because contaminant movement pathways and effects are not fully understood, and with new xenobiotic chemicals increasingly present, it is not always clear what will be the most sensitive receptor. Biological effects monitoring methods are varied dependent upon the nature of the threat. They are an important component of the UKMMASCSEMP monitoring programme. They may comprise study of any impact of the test chemical on a particularly sensitive phase of a marine organism's life cycle (such as the initial development of oyster embryos, or the feeding rate of a bivalve mollusc); the production of a chemical by the test organism in response to contaminant exposure; or an adverse growth development such as 'imposex' in certain (commercial) molluscs exposed to extremely low concentrations of tributyltin ( TBT) antifouling compounds. Use of TBT based anti-foulants has been phased out over the last 20 years, but effects can still be seen.
Bioaccumulation studies are well established, and Scotland has some long and growing time series of results. These show a general decline in concentrations of long-lived chemicals whose use was banned years ago (such as DDT and PCBs), but concentrations of other newer chemicals, especially plasticisers and flame retardants, are now present or increasing where they were previously absent. Analysis of modern synthetic chemicals at the low levels found in environmental samples is very expensive and time consuming. It is therefore important that scant resources are targeted at the substances that represent the most genuine risk. More biological effects testing could help by helping screen substances allowing an assessment to be made of which are potentially more problematic. Unfortunately the raft of EU regulations currently determine which substances must be looked for and this may include contaminants not expected in Scottish waters and does not include some that have a high probability of being present.
Much of the assessment of hazardous substances is performed on an individual compound or compound group basis. There is a need to assess the likely impacts of mixtures of hazardous substances in the marine environment, since it is mixtures rather than single compounds to which marine biota are exposed. Climate change is much discussed but it is not yet clear how this will affect water quality although there is some evidence that the seas are likely to become more acidic. Monitoring these small changes is quite difficult and such work has barely begun in Scottish seas (see Chapters 2 and 6). Changes in ocean currents could also affect the temperature of Scottish waters and the recycling of nutrients, both of which could effect primary production and any dependent biota.
Contact
Email: Central Enquiries Unit ceu@gov.scot