Scotland's seas: towards understanding their state
Scotland's seas: towards understanding their state.
Chapter 2 Physical Characteristics and Modelling of the Marine Environment
INTRODUCTION
The waters around Scotland are diverse in their physical characteristics. In the coastal zone the coastline varies between deep and narrow sheltered sea lochs on the west coast, shallow bays and estuaries, and long straight stretches of coastline that have little shelter from waves and storms. The major Scottish estuaries are the Solway Firth, the Clyde Sea, the Moray Firth, the Firth of Tay and the Firth of Forth (Figure 2.1).
Figure 2.1 Bathymetry, specific boundaries and selected geographical features of the seas around Scotland
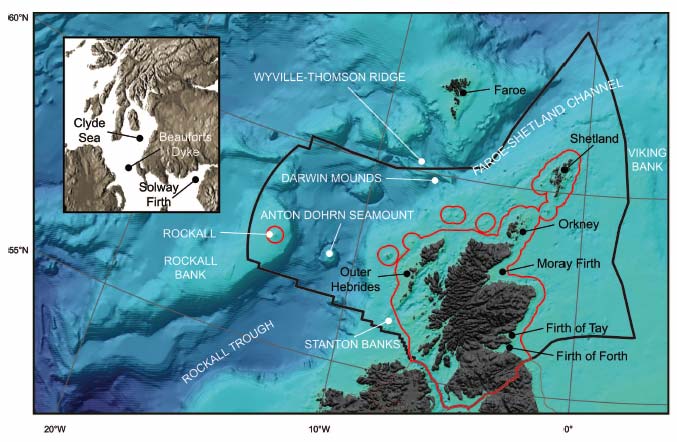
Table 2.1 details the latitude and longitude of the approximate centre of the features included. Red line = 12 nm limit; Black line = Scottish fisheries limits.
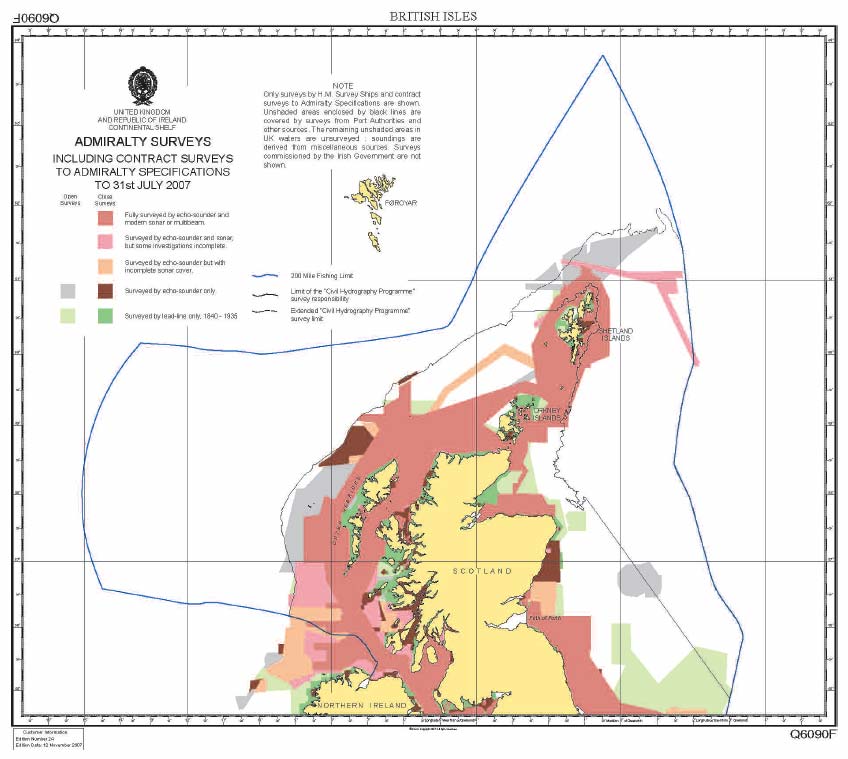
The offshore environment in Scottish waters ranges from shelf sea areas which are generally shallower than 250 m (average ~100 m) and deep ocean regions with depths greater than 2,000 m. The continental shelf includes the Malin and Hebrides Shelf Seas, Orkney and Shetland Shelf Seas, and the North Sea. The shelf seas are marked by notable features such as banks (e.g. Stanton Banks, Viking Bank) and deep channels (e.g. Beauforts Dyke). It is interesting to note that, in terms of Admiralty surveys, there remain some coastal areas of Scotland for which the survey data has been gathered by lead line only (Figure 2.2).
Table 2.1 Latitude and longitude of the approximate centre of features included in Figure 2.1
Feature |
Latitude |
Longitude |
|---|---|---|
Solway Firth |
54.80 N |
3.53 W |
Clyde Sea |
55.87 N |
4.94 W |
Firth of Tay |
56.43 N |
2.74 W |
Firth of Forth |
56.08 N |
3.02 W |
Moray Firth |
57.66 N |
3.92 W |
Orkney |
59.05 N |
2.95 W |
Shetland |
60.31 N |
1.29 W |
Faroe |
62.13 N |
6.94 W |
Outer Hebrides |
57.84 N |
7.10 W |
Beauforts Dyke |
54.72 N |
5.25 W |
Stanton Banks |
56.21 N |
7.79 W |
Viking Bank |
60.28 N |
2.41E |
Wyville-Thomson Ridge |
60.11 N |
7.67 W |
Rockall Trough |
56.08 N |
11.69 W |
Anton Dohrn Seamount |
57.47 N |
11.08 W |
Rockall |
57.57 N |
13.55 W |
Darwin Mounds |
59.62 N |
7.22 W |
Figure 2.2 The extent and nature of Admiralty Surveys conducted under the Civil Hydrography Programme (to 31 July 2007)
The western margin of the continental shelf is marked by a sharp change in the depth of the seabed. From less than 250 m, the continental slope drops rapidly into water deeper than 2,000 m. The continental slope is a transition area between two systems; the deeper oceanic waters and the shelf sea waters. The deep ocean areas have a complex bathymetry that is broken up by steep ridges (e.g. Wyville-Thomson Ridge), seamounts (e.g. Anton Dohrn) and banks [A] (e.g. Rockall Bank).
These deep waters west of Scotland were the location of some of the pioneering studies of deep-sea research when, between 1868 and 1890, HMSLightning and HMSPorcupine first sampled this area ultimately leading to the discovery that the deep sea is not a quiescent, unchanging desert, but is an extremely dynamic region which can contain an astonishingly high diversity of species. There is, however, still a huge amount not known about this area, but with time, understanding of the deeper waters to the west of Scotland is improving.
PHYSICAL CHARACTERISTICS
Weather and climatic conditions
Scotland has a maritime climate strongly influenced by the oceanic waters of the North Atlantic and prevailing south-westerly winds. As these winds blow over the regions of the North Atlantic warmed by the North Atlantic current, they pick up heat which is delivered to Scotland, giving Scotland a relatively mild, wet climate considering its latitude. As such, changes in the strength of the Atlantic Ocean circulation have a significant effect on the climate of Scotland.
Normally, in the atmosphere over the North Atlantic, a low-pressure area is situated in the north, near Iceland, and a high-pressure area is situated in the south of the region near the Azores. This pattern of sea-level pressure results in a stream of smaller, secondary depressions, travelling in a north-eastward direction between these two regions. The passage of these depressions account for the variable weather experienced in Scotland and although the predominant wind direction is from the south-west, wind direction varies as depressions pass. The depressions are often more intense during winter months bringing with them gales, which in the windiest places (Western Isles, Orkney and Shetland) can occur up to 30 days peryear.
The low-lying areas on the west coast of Scotland that are exposed to the Atlantic Ocean tend to have more cloud, less sunshine and be slightly warmer and wetter than the east of Scotland (Figure 2.3). Mean annual air temperatures in low-lying areas are between 7-9°C. However, sea fog (haar) from the North Sea is common in the spring and summer, particularly in the Northern Isles and on the east coast.
Rainfall over Scotland is high compared to the UK as a whole. Total rainfall is 113,150 million cubic metres per year of which 73% is estimated to runoff into the sea. This equates to approximately 1 million cubic metres runoff per square km of land (1).
The latitude of Scotland means that there are large variations in day length throughout the year with some northern areas receiving almost 24 hours daylight in midsummer and just a few hours of daylight at midwinter. The duration of light availability is known to produce a varied response in different phytoplankton species. The short, dark winter days that are typical of the north of Scotland mean that phytoplankton growth is considerably reduced between the months of November and February and very low cell abundances are observed in the water column. In contrast, some phytoplankton growth is observed in more southerly latitudes of the UK during the winter period. Extended photoperiod, which is the time that uninterrupted light is present, has also been shown to affect the toxin production of some phytoplankton routinely detected in Scottish waters such as Pseudo-nitzschia seriata(2), see Case Study 5.1.
Currents and circulation
Scotland's position on the UK continental shelf (Figure 2.1) means that the seas around Scotland are directly affected by oceanic circulation. The ocean circulation in the North Atlantic is dominated by two gyres, the southernmost of this is called the sub-tropical gyre. Although it is often stated that the Gulf Stream, as part of the sub-tropical gyre circulation, brings warmth and milder conditions to Scotland's shores it is more correct to refer to the North Atlantic Current. This current is partly wind driven and partly driven by the density differences between the warmer, southern water and the cooler, northern water. Despite the significance of this circulation, current speeds and depth-averaged tidal velocities are relatively low. Currents speeds can be enhanced around topographic features, so areas such as the Rockall Bank and the edge of the continental shelf can have strong currents associated with them.
Figure 2.3 Annual average (1971-2000) meteorological conditions for Scotland
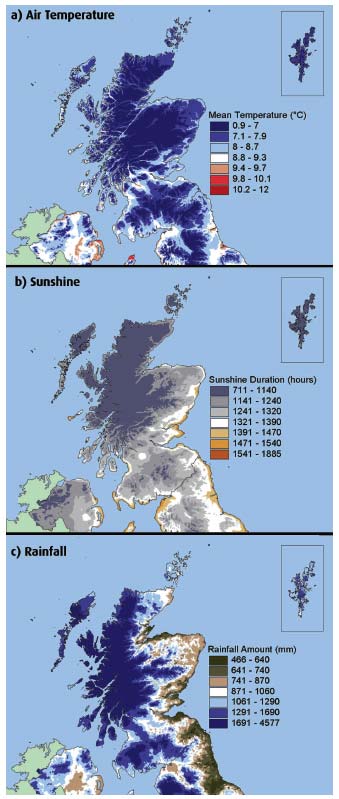
© Crown Copyright 2008, Met office
The map (Figure 2.4) only gives a schematic of the general pattern of currents and does not show the detail associated with the complex circulation of water. Background current speeds can also be enhanced over shorter timescales by complex effects such as mesoscale meanders and eddies, internal tides, internal waves and storm surges.
Figure 2.4 Circulation in the offshore and coastal waters around Scotland
Map shows the circulation of surface waters. Red arrows are the flow of warm, salty Atlantic waters along the continental slope and further west. Yellow, blue and green arrows show the flow of coastal waters. Yellow arrow shows the path of the Scottish Coastal Current. Blue arrow shows the inflow of mixed coastal/oceanic water past Fair Isle (the Fair Isle Current).
As well as the surface circulation shown in Figure 2.4, there is a flow of deep water returning at depth from the Arctic. This is evident from the presence of cold water at depth in the Faroe-Shetland Channel (below 400-600 m) that has its origin in the Iceland, Greenland and Norwegian Seas. Two technical terms often associated with this circulation are the Thermohaline Circulation and, more recently, the Meridional Overturning Circulation ( MOC). The MOC has been the subject of intense study in recent years, because of its significant contribution to climate variability and the possibility that the effects of global climate change will weaken the MOC (see Chapter 6). The deep waters from the Arctic, which travel in a south-eastward direction through the Faroe-Shetland Channel, are diverted westward by the Wyville-Thomson Ridge (Figure 2.1) and eventually spill over into the deep basin of the Rockall Trough. There are also intermittent overflows through deep channels in the Wyville-Thomson Ridge that are as yet unquantified. Changes in the properties of the deep water are thought to be indicative of changes in the surface circulation and the wider scale climatic changes. Two hydrographic sections across the Faroe-Shetland Channel have been surveyed by FRS for over a century and are situated at a key point to allow FRS to monitor these changes (see Chapter 6). Since 1994 the addition of current meters has allowed scientists to study changes in the volume of water passing through the Faroe-Shetland Channel.
In addition to the North Atlantic Current, a jet-like current, known as the Slope Current, flows in a poleward direction along the edge of the continental slope (Figure 2.4) as a persistent slope current with speeds in the range of 15 to 30 cm/s, and centred approximately over the 400-500 m isobath. The waters in the Slope Current originate from the Iberian region and some of the North Atlantic Water that reaches the Bay of Biscay joins the Slope Current. The Slope Current is an important source of heat, nutrients and plankton to the waters around Scotland. It appears to vary with the seasons, and can be stronger in winter than in summer. Its strength and direction can also be affected by local winds.
The steep bathymetry of the continental slope acts as a barrier between oceanic regions and the shelf sea systems, reducing the amount of water that can travel from the deeper waters of the North Atlantic into the shallower waters on the continental shelf. Processes that cause mixing of oceanic waters and shelf sea waters are complex but have a significant impact on conditions in Scottish waters. Waters from the North Atlantic enter the North Sea between Orkney and Shetland and around the north-east of Shetland as well as through the deep Norwegian Trench (Figure 2.4).
Tidal currents are predictable and stronger than the residual current in many areas. Tidal currents cause mixing in the water column and therefore often determine the location and extent to which the water column is stratified into different distinct layers. Tidal currents are intensified in localised areas (Figure 2.5), usually where the flow is constrained by topography. This includes areas such as between Orkney and Shetland, the Pentland Firth, off the Mull of Kintyre and Hebrides where tidal streams can be as high as 3.5-4.5 m/s. However, when the transport of water around Scotland is considered, the overall effect of the tides is quite small as tidal currents mainly move water back and forth.
The residual circulation in the North Sea is predominantly anti-clockwise and circulation on the shelf west of Scotland (the Scottish Coastal Current) is mainly northwards. However, this circulation is strongly affected by winds and density-driven coastal currents and jets, which can lead to significant changes and even a reversal of this general pattern for short periods (Figure 2.4).
Flow variability on the Scottish west coast is being studied using a current meter mooring in the Tiree Passage (Case Study 2.1). Such measurements of currents, together with determination of salinity and temperature, provide an essential background understanding of the physical characteristics of Scottish waters which have a direct effect on the ecology of Scottish seas.
Temperature and salinity
Sea temperatures around Scotland are affected by local climatic conditions (heat flux with atmosphere) and the heat transferred to the shores of Scotland by ocean currents (advective effects). Sea surface temperatures vary with an annual cycle, lagging behind the cycle of atmospheric temperature by around one month.
Average sea temperatures around Scotland reflect the influence of heat transported from oceanic waters (a specific example of the Tiree Passage is presented in Case Study 2.1). On average, the winter temperatures on the west coast of Scotland are higher than those on the east coast. In the summer this situation is reversed as waters in the shallower North Sea warm up more quickly and so summer temperatures on the east coast are higher than on the west coast. The influence of the North Atlantic Current and climate system can also be observed in the long-term variability of sea surface temperatures.
In deeper waters, the circulation patterns strongly influence temperatures, with returning cold water of Arctic origin filling the deep basins below about 800 m and intermediate waters lying between this and the warmer Atlantic waters above.
Figure 2.5 Mean spring tidal range (m) and peak current flow (m/s) for a mean spring tide for the seas around Scotland
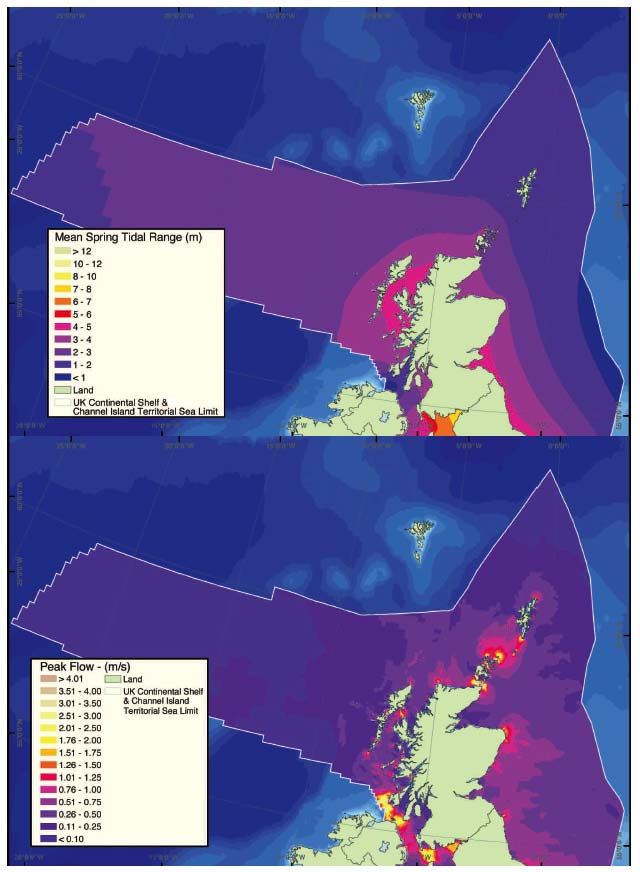
Source: Atlas of Marine Renewable Energy (Bathymetry, Waves, Wind, Tides)
http://www.berr.gov.uk/energy/sources/renewables/explained/wind/page27741.html
Salinity in the open ocean is controlled by the balance between evaporation (freshwater out) and precipitation (freshwater in). In coastal waters the direct input of freshwater from land run-off and rivers dominates the changes in salinity. Many shelf areas are affected by freshwater inputs. Areas of high freshwater influence are the large estuaries and adjacent coastal waters of the Clyde, Solway Firth, Moray Firth, Firth of Tay and Firth of Forth as well as coastal areas on the west coast that receive a lot of freshwater from land runoff and numerous small rivers (Figure 2.6).
The physical characteristics of the waters in the shelf seas off Scotland are important because of their effect on the marine ecosystem. These characteristics are largely determined by a balance between the surface heating from the sun and freshwater run-off from the land, and the mixing influences of the strong tidally and wind driven flows, themselves shaped by the intricate and irregular bathymetry and coastline. The combination of these factors results in regions that are stratified and regions that are well mixed, with complex frontal systems between them (Figure 2.6).
It is also important to note the particular characteristics of sea lochs. Many west coast Scottish sea lochs have restricted water exchange with the surrounding seas, particularly those with a sill at the mouth of the loch.
Figure 2.6 Water column features on the Scottish continental shelf in winter
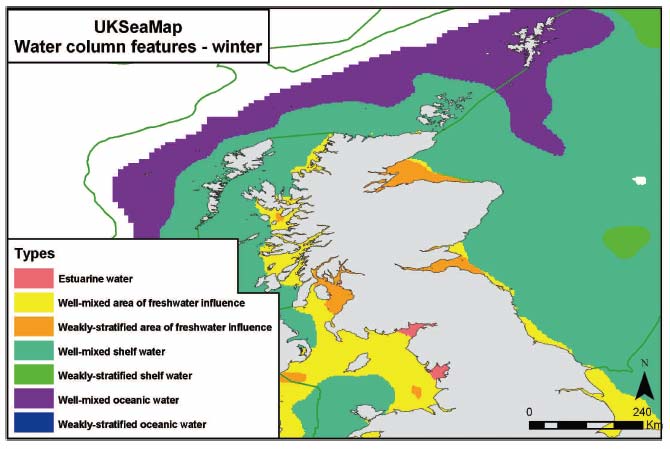
Source: Connor, D.W., Gilliland, P.M., Golding, N., Robinson, P., Todd, D. and Verling, E. 2006. UKSeaMap: the mapping of seabed and water column features of UK seas. Joint Nature Conservation Committee, Peterborough.
Sea-level
Sea-levels are affected over short timescales by the rise and fall of the tide as well as the effects of storm surges. Over longer timescales, the sea-level is affected by global climate change and movements of land masses relative to the earth's crust.
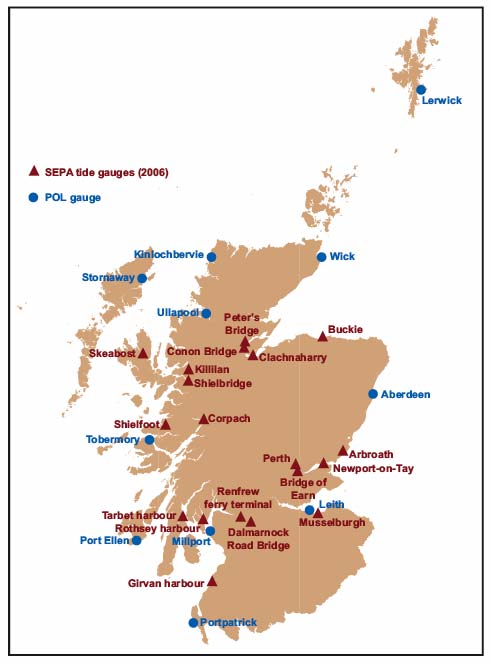
The principal tidal components are the semi-diurnal (twice daily) tides although in some limited regions the diurnal (daily) tides are significant. The UK National Tide Gauge Network, run by the Tide Gauge Inspectorate, records tidal elevations at a number of locations around the UK coast of which 11 are located in Scotland. These measurements, together with those provided by the SEPA Tide Gauge Network (Figure 2.7), provide a long time series of reliable and accurate sea-level data. Tidal range is generally between 4 and 5 m; highest tidal ranges are found in the inner Solway Firth (Figure 2.5) where the mean spring tidal range can be between 7 and 8 m. Tidal range is at a minimum in areas known as amphidromic points. One of these points occurs in Scottish waters between Islay and the Mull of Kintyre; another amphidromic point can be found in the north-east of the North Sea. Tidal range decreases with distance offshore from the north-east coast.
Figure 2.7 SEPA Tidal Gauge locations and Scottish locations of the UK National Tide Gauge Network ( POL gauge)
CASE STUDY 2.1 Climatic variability in the seas to the west of Scotland (3)
Background
Temperature, salinity and flow variability on the north-west European continental shelf to the west of Scotland are examined in this case study. Analyses are derived from a range of marine and atmospheric data sources which together comprise a "proto marine observatory".
Surveys and data sources
The main time series are from a current meter mooring which has been maintained by SAMS in the Tiree Passage between the islands of Coll and Mull (Figure 2.8) since June 1981, and from a hydrographic section repeated at least annually since 1975 across the shelf at the mooring latitude and out to Rockall. Additional time series used are from the UK Tide Gauge Network (main text Figure 2.7) and Met Office weather records.
Figure 2.8 Location of the current meter mooring in the Tiree Passage between the islands of Coll and Mull
Results and Interpretation
The mean water temperature in the Tiree Passage is 10.1 ºC and the dominant mode of variability in the temperature record is the seasonal cycle, with an amplitude of 3.2 ºC. Temperature anomaly time series (deviations from the average monthly values over the last 25 years) from the Tiree Passage and of the full NE Atlantic upper layer show highs in the late 1980s and late 1990s and lows in the early 1980s and mid 1990s. The overall trend on the continental shelf is of warming at a rate of +0.57 ºC per decade (Figure 2.9). In addition, it was found that the date of maximum annual temperature has been delayed by 12 days per decade, throughout the time series. However, it should be noted these historical trends do not mean that the rates of change will be the same into the future.
Shelf salinities showed only weak seasonality, in contradiction to previous published analyses. No single determining factor has been found for the longitudinal movement of more saline oceanic waters across the shelf. Prolonged periods of high North Atlantic Oscillation index ( NAO) were found to coincide with periods of raised salinity of shelf waters ( NAO: high values of this index correspond to warm, wet and windy conditions over Scotland).
The water currents in the Tiree Passage are constrained by the coastline and are dominated by the semi-diurnal tides (12.42 and 12 hours). There is also significant seasonal variation in the flow rate. After removal of the effects of tidal currents, the residual flow has a mean value of 10.8 cm/s directed towards the north which is likely to be caused by the Scottish Coastal Current (Figure 2.4). There were very few, short duration periods of flow reversal. Application of a simple model to the flow in the passage (using tide gauge, atmospheric pressure and wind observations) demonstrates that wind changes are the dominant factor accounting for variability of the northward flow, and both the north/south gradient in sea-level slope and atmospheric pressure are significant in driving the coastal current northwards. Applying this balance model to these year-round data has revealed a bias in previous summer-only estimates of the flow rate of the coastal current. A revised figure for the strength of the Scottish Coastal Current of approximately twice previous estimates is therefore proposed. Residual winter flows correlate significantly with the North Atlantic Oscillation index (r = 0.59) (Figure 2.10).
Figure 2.9 Monthly temperature anomalies from the Tiree Passage temperature time series
Trend shows an increase in temperature of 0.57 ºC per decade. Error estimates of 1 standard deviation are shown.
Figure 2.10 Winter (December, January, February, March ( DJFM)) NAO and the winter average northward flow (divided by a factor of two) through the Tiree Passage
Summary Assessment
Parameter |
Geographical |
Key factors & |
What the |
Trend |
Status |
Confidence in |
Reason for |
|---|---|---|---|---|---|---|---|
Water |
Sea of the |
NE Atlantic |
Warning trend |
|
III |
Sufficient |
Tidal surges caused by storms do occur in Scotland, and mainly affect the east coast. However, storm surges are less significant around Scotland than in regions further south because of the way that the surges grow as they propagate southward. For example, the most significant storm surge ever recorded over the last 100 years occurred in 1953. During that event surge levels of 0.6 m and 0.83 m were recorded at Aberdeen and Leith respectively, but reached 2.97 m in southern England (King's Lynn) and 3.36 m in the Netherlands (4). The 1 in 50 year storm surge predictions for Scotland are around 1.25 m.
Waves
Sea-surface waves are mainly a wind-driven phenomenon, and their height is predominantly determined by the fetch (i.e. distance wind has blown over) and length of time of the wind forcing. The seabed also influences waves in shallow water as waves will become steeper and higher as they approach the shore.
Within Scottish waters, the wave climate is mainly influenced by conditions in the North Atlantic ocean, where the fetch is long enough to establish large swell waves. The north and west of Scotland (Hebrides, Orkney and Shetland) are most exposed to these conditions. Waves on the east coast of these islands are smaller due to their comparatively sheltered nature. On the east coast of Scotland, conditions in autumn and winter may also be rough in the North Sea due to the wind direction being such that there is a large fetch. Moreover, the Moray Firth is also relatively exposed because of its shoaling bathymetry and exposure to the North Sea. Figure 2.11 shows the significant wave height (the average height of the highest 1/3 waves) and the wind speed for Scotland.
Figure 2.11 Annual mean wind speed (m/s) and annual mean wave height (m)
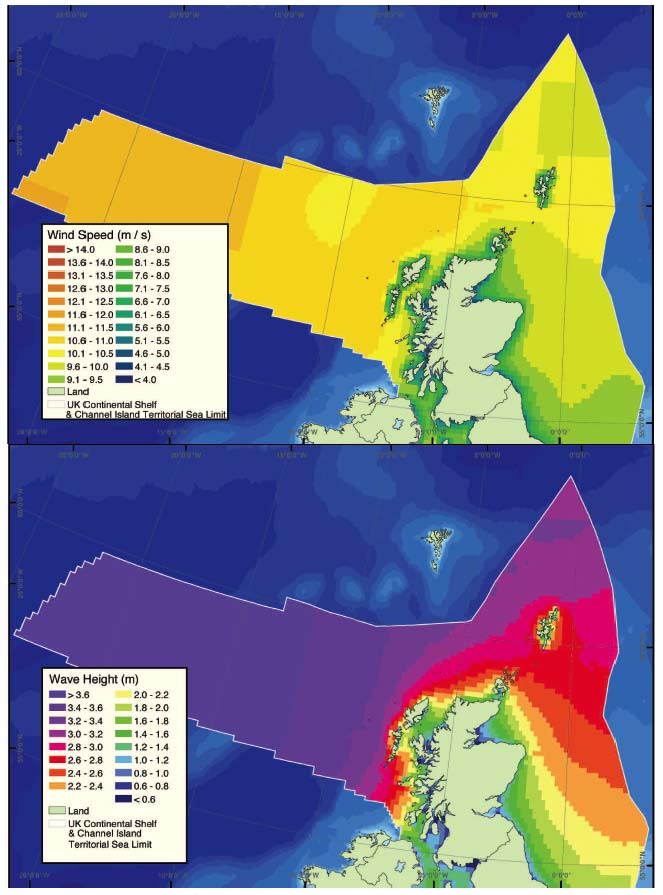
Source: Atlas of Marine Renewable Energy (Bathymetry, Waves, Wind, Tides)
http://www.berr.gov.uk/energy/sources/renewables/explained/wind/page27741.html
Turbidity
Turbidity, a measure of how clear the water is, is generally determined by which particles are suspended in the water column, and their concentration. Suspended solids are generally highest in areas close to land (due to run-off) and in shallow regions where currents and waves are sufficiently strong to resuspend bottom sediments. Other than biological (e.g. phytoplankton cells) and mineral (sediment) particles, the water colour may also be influenced by Coloured Dissolved Organic Matter ( CDOM), that is released by decaying terrestrial and marine plants. Due to the relatively larger release from terrestrial plants, the input of significant concentrations of CDOM is mainly confined to coastal areas with a large freshwater input (5).
Turbidity is highest in coastal areas with a large fresh water input, such as the Clyde Sea, Firth of Lorn and the Forth/Tay river plume. Compared to the southern North Sea, the Scottish North Sea has much lower concentrations of suspended sediment (Figure 2.12). The turbidity of the water influences the productivity, as murky waters limit the penetration of light and can inhibit photosynthesis (5).
Figure 2.12 Map showing modelled turbidity (mg/l) in coastal waters of Scotland (6)
The model data are a monthly average of the Suspended Particulate Matter ( SPM) concentration at 45 and 5 m depth from the European Regional Seas Ecosystem Model ( ERSEM) for the month of February. Higher concentrations are evident near the coasts, with low concentrations in the deep ocean. High concentrations are also identified near larger estuaries, such as Clyde and Firth of Forth/Tay, and in locations with strong currents such as the region between Northern Ireland and Mull of Kintyre.
pH
There are no existing observations of pH in Scottish waters. In future, pH is likely to be one of the water property measurements requiring increased attention due to its importance for ocean acidification. The effects of increased acidity of waters will be most pertinent for primary producers (phytoplankton), although through higher trophic links, the grazing community and their predators may also be affected (7,8).
Sediment concentration and transport
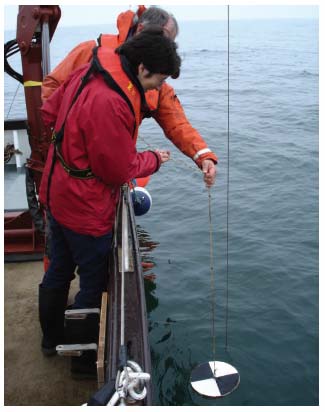
When looking out over the sea, the presence of water is very evident. What is less evident is that within the water is suspended particulate material ( SPM) which comprises mineral particles, living plankton and phyto-detritus. The focus in this section is on the mineral particles and the sedimentary processes which lead to the distribution of seabed sediments observed around Scotland. As mentioned above, there is an association between SPM and the turbidity of marine waters. Many monitoring programmes include measurements of suspended sediment and turbidity, often using a device to measure optical back-scatter. However, the more traditional method, of measuring the depth at which the black and white segments of a Secchi Disk (Figure 2.13) are no longer discernable, although of limited use, still provides a quick assessment of water clarity.
Sedimentary processes and transport
Sedimentary processes affect the coastal and marine environment in a number of ways. These include:
- the evolution of the coast, the foreshore and the sea bed;
- the transport of contaminants, especially those which have a high octanol/water partition coefficient and thus bind strongly to the fine sediment particles; and
- the species composition and population of benthic communities.
In terms of species composition, the fine muddy sediments with a high organic matter content can support a wide variety of molluscs, worms and crustaceans while sandy sediments tend to support fauna that are adapted to life in relatively mobile substrate.
Sediment resuspension, transport and deposition are mainly influenced by the sediment type and availability, and by the nature of the currents and waves. The movement of most types and sizes of sediment grains will occur only when the waves and/or currents are strong enough to exceed the threshold of motion for particular grain sizes. Very fine grains will tend to be transported at the same rate as the transporting fluid but, for sands and gravels, the pathways of sediment transport may be very different to the distribution of the residual current.
Figure 2.13 Measuring water clarity at the FRS Ecosystem Monitoring site off Stonehaven using a Secchi Disk
The character of the shelf sea bed is highly variable and reflects both modern tidal and current patterns, and past currents that affected sediment accumulation. The sea bed varies from mud to rock and a more detailed description of the seabed sediments around Scotland is presented in Case Study 2.2. However, a better knowledge of seabed sediments is required for habitat mapping, offshore renewable energy, oil and gas development, aggregate extraction, fisheries, environmental monitoring, marine and coastal planning and legislation. Ultimately, modern instrumentation, such as multi-beam echo-sounders, can now provide such high-resolution information. This technique is being used by marine management organisations and the commercial sector to gather depth information that reveals the shape of the sea-floor, and provide acoustic images of the physical properties of the sea bed that can be used to compile detailed and accurate geological maps of the sea-floor. An example of this is provided in Figure 2.14 and on the attached CD. The data were collected by BGS from a small area of the Firth of Forth surrounding the road and rail bridges. Using 'fly-through' software, the sea bed can be observed in detail to identify geological features such as the igneous rocks that crop out at the sea-floor. The images (Figure 2.14 and the 'fly-through' on the CD) clearly show how designers of the Forth bridges used these rock outcrops to provide a solid foundation for the construction of both bridges.
Figure 2.14 Rock outcrops used to support the Firth of Forth bridges obtained using multi-beam echo-sounders
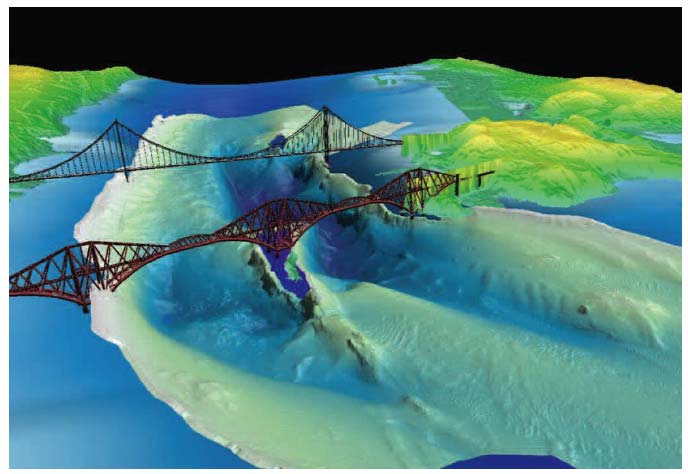
A full 'fly-through' of this area of the seabed and further information is available in Annex 6 on the CD.
On a very different geographical scale, the Frontispiece to this report is a map of the Scottish land and sea areas showing the morphology of the country's terrain. Onshore topography is from NEXTMap Britain (©Intermap Technologies) in which heights of land features are acquired from an aircraft using radar technology. The data have a very high vertical resolution. The marine dataset is part of the Olex bathymetric database compiled, processed and managed by the Norwegian company Olex AS. The seabed image is based upon echo-sounder data acquired mainly by commercial fishing vessels, but also including data from research vessels. The datasets are contributed voluntarily, the data are then individually merged with the central dataset, after which the contributor has access to all of the shared bathymetry. The database represents the earth's surface as a series of 5 x 5 m cells. Vertical resolution is 1 m in deep areas and 0.1 m at depths less than 100 m. This means that relative depths are highly accurate with an error range of only 1-2%. Quality assurance is achieved by comparing an individual contributor with the large number of other soundings covering the same area. Although the data are not complete for the offshore area, this example illustrates the advantages of sharing data acquired from different sources. What these two examples show is that detailed information is becoming increasingly available. This will be of value to all those interested in the Scottish marine environment.
EVIDENCE FOR THE STATE OF PHYSICAL CHARACTERISTICS OF THE SEA
There is a difference in the precision, accuracy and quantity of evidence available on the physical characteristics of the state of Scotland's seas. Some data are periodically collected and cover large regions (e.g. thermosalinograph is an automated sea-surface temperature and salinity measurement system making measurements from a ship throughout its cruise), whereas other data are collected frequently, but only at a few locations (e.g. circulation data, wave heights). A vast amount of data are currently being collected on temperature (both sea surface, and profiles) and the salinity of Scotland's seas.
Table 2.2 summarises some of the physical data collected in Scotland's seas. A considerable amount of these data are collected in the coastal waters, particularly in the Minches and Malin Sea, East Scotland Coast, and Shetland areas. There are often only sparse data available for the offshore areas, although this situation is improving all the time with an increased amount of data being collected in offshore areas. In addition, models are being used to predict physical characteristics for these areas (e.g. waves and circulation).
Table 2.2 Summary of data collected on the physical characteristics of Scotland's seas
Physical characteristics |
Data collector 1 |
|---|---|
Air temperature |
British Atmospheric Data Centre ( BADC), FRS, Met Office |
Bathymetry |
BGS, Fishing Industry, Hydrographic Office |
Bottom pressure |
Institute of Oceanographic Sciences, NASA |
Changes in seal-level, coast and seabed |
POL, SEPA |
Currents and circulation |
FRS, POL, SAMS, SEPA |
Freshwater inputs from major rivers |
SEPA |
North Atlantic Oscillation index |
Climatic Research Unit at the University of East Anglia |
pH |
International Council for the Exploration of the Seas ( ICES) |
Rainfall |
BADC, Met Office, SEPA |
Salinity |
FRS, ICES, POL, SEPA, SNH |
Sea temperature (surface and profiles) |
FRS, ICES, Met Office, SAMS, SEPA |
Sediment concentration and transport |
BGS, Satellite Observing Systems Ltd |
Thermohaline profile |
SAMS |
Waves |
Met Office, Surf Observer Program, POL, Satellite Observing Systems Ltd, University of Aberdeen |
Wind direction and speed |
BADC, FRS, Met Office |
1 The term 'data collector' includes organisations who may act as a repository for data collected by another organisation (e.g. ICES)
MODELLING THE MARINE ENVIRONMENT
There is a significant challenge associated with characterising the marine environment because of its complexity and limited data. However, perhaps an even greater challenge is to have the capacity to link different data in a manner that can allow us to develop an understanding of marine processes. Models can be used to describe the physical, chemical and ecological processes in the marine environment. This allows the effects of changes in the sea (natural or man made) to be simulated and predictions to be made. These prediction scenarios are often used to aid decisions relating to public and maritime safety, environmental protection and economic development. Increasingly, they will also aid in the assessment of the state of the seas. The continual improvement in computing power permits models to be used to study, for example, the early life history of fish, shelf sea circulation and the environmental impacts of aquaculture. A further example, the use of data from multi-beam echo-sounders to improve computer model performance, is presented in Case Study 2.3. However, there remain many modelling challenges. For example, accurate forecasting of salinity is a major modelling difficulty, particularly around the west coast of Scotland where land run-off is not well described. Also, as models are expensive to produce and their calibration requires hard data they generally have a particular geographic or functional focus which limits their use elsewhere without further development.
The modelling of Scotland's seas
A considerable number of organisations have an interest in simulating the seas around Scotland at different scales. These range from the inclusion of our seas in global climate models, through to the simulation of coastal flooding/erosion and the disposal of waste. In this context, many Scottish organisations contribute to the international efforts to improve understanding and modelling of our seas. For example, Scotland's west coast has many fjordic sea lochs and there is a need to improve our knowledge of fjordic processes. These environments are challenging to model and are fertile ground for testing improvements to modelling capability. Examples of Government and Academic organisations carrying out modelling in Scottish seas are detailed in Table 2.3.
A specific area of interest is operational oceanographic forecasting of the UK coastal and shelf seas. Recently a strategic partnership between the Met Office and the Proudman Oceanographic Laboratory (Liverpool), Plymouth Marine Laboratory, National Oceanography Centre Southampton and the Environmental Systems Science Centre (Reading) was established to facilitate this process. The National Centre for Ocean Forecasting ( NCOF; http://www.ncof.co.uk/) presently has no Scottish representation.
Commercial organisations also carry out a wide range of modelling around Scotland's waters, for example to predict the impact of waste disposal from fish farming, industrial activity and public sewerage systems, or modelling relating to coastal flooding, coastal erosion and defence, renewable energy and seabed and coastal engineering works.
Table 2.3 Organisations involved in modelling Scottish seas
Task |
Examples of Organisations Involved |
|---|---|
Climate Change Modelling |
Met Office |
Storm Surge Modelling & Coastal Flooding |
Met Office, POL, SEPA |
Oil/Chemical Spill Modelling |
Marine and Coastguard Agency ( MCA), Cefas |
Fisheries and Aquaculture |
FRS, SEPA |
Coastal Water Quality |
SEPA, FRS |
Physical, Chemical and Ecological Modelling Research |
SAMS, FRS, CEFAS, POL, Universities of St Andrews, Strathclyde, Dundee, Bangor and Southampton. |
Fisheries and Aquaculture Modelling Research |
FRS, SEPA |
Specific examples of modelling studies in Scotland's seas include:
- Aquaculture: The Scottish Aquaculture Research Forum ( SARF) commissioned two modelling studies relating to 'The Assimilative Capacity of Sea-Lochs and The Fate of Aquaculture Waste'. FRS is undertaking research into the modelling of sea lice dispersal;
- Bathing Water Quality: Scottish Water commissioned two major modelling studies (Ayrshire Coast and Forth Estuary) to identify how drainage investment could help contribute to bathing water improvement;
- Coastal Flood Warning: SEPA currently operates a Firth of Clyde and Clyde Estuary flood warning modelling system;
- Clyde Estuary: The existing SEPA model of the Clyde Estuary was upgraded and utilised, by commercial consultants, during the Glasgow Strategic Drainage Plan ( GSDP) study;
- Forth Estuary: Scottish Power commissioned a modelling study of the Forth Estuary to predict the impacts of changes to their discharge from Longannet power station; and
- Aberdeen Beach: Aberdeen City Council commissioned a modelling study to examine options for coastal erosion defence.
Data
All computer models require real environmental data to work effectively. The disciplines of measurement and modelling are intrinsically linked. A lack of data in any modelling exercise can introduce uncertainty and lead to unreliable results. Much of the data collected in Scottish seas are used to set up models or check their performance. Modelling often benefits from targeted, simultaneous, data collection, where many different parameters are collected throughout the area to be modelled. One key marine environmental data-set that benefits virtually all those involved in modelling is the water depth (bathymetry). The existing quality, and coverage, of bathymetry data around Scotland is, as mentioned earlier, variable (see Figure 2.2). Case Study 2.3 explores the effect of bathymetry on the performance of a marine model.
Communication
The construction and operation of computer models of the sea include many common steps which are sometimes independent of the final application. At present many of these common steps are duplicated for different modelling studies. All those involved in the simulation of the waters around Scotland would benefit from a greater sharing of model information and data.
Output from large-scale models can often be used to drive smaller, more detailed, models of specific areas of interest. NCOF runs a global ocean model, a higher resolution North Atlantic Ocean model, and an even higher resolution UK shelf seas model. The resolution of the shelf model is 6 km. However, this only poorly describes the Scottish coastline, particularly the west coast. A high resolution sub-model for the Irish Sea (1.8 km) is run by the Proudman Oceanographic Laboratory which also has a research grade 1.8 km model for the full UK shelf. It would be highly desirable to see an operational high resolution model of the seas surrounding Scotland (1.8 km or finer). Access to information from a common model of Scotland's seas would provide more accurate inputs to smaller scale local models, benefiting many types of studies.
Combining physics, chemistry and biology
Oceanographic processes bring nutrients (phosphate, nitrate, silicate and ammonia) to the surface waters where there is sufficient light to permit the fixation of carbon through photosynthesis. This chemical process requires, in addition to nutrients, trace elements and facilitates the growth of phytoplankton. The capturing of energy is crucial to the overall productivity of the marine ecosystem and will, to an extent, dictate the subsequent fisheries productivity and overall biodiversity in a region. Understanding the physical characteristics, chemical reactions and ecological processes which result in, for example, a substantial fishery is complex and requires the use of computer modelling as well as the adoption of an integrated, multi-faceted approach. This is illustrated in Case Study 2.4 which shows how estimates of new primary production in Scottish waters are produced and discusses their implications. This extended case study provides an insight into what can be achieved when the various marine disciplines are combined. It also makes individual regional assessments right round the Scottish coast, something which, in time, it is hoped can be achieved for many other assessments.
CASE STUDY 2.2 Seabed sediment
Knowledge of the seabed sediments around Scotland is primarily based on surveys undertaken by the British Geological Survey ( BGS) in the 1970s and '80s, when the DTI sponsored a major reconnaissance mapping programme based on seabed samples and seismic reflection data. Approximately 15,000 samples were taken a few kilometres apart and a grid of seismic data were collected on a line spacing of 2 to 5 km. Over 50 maps at 1:250,000, 1:500,000 and 1:1,000,000 scales depicting the bedrock geology, the overlying unconsolidated sediments and the seabed sediments were published. Much of this information is also available within various digital products and has been described in six regional reports (9-14).
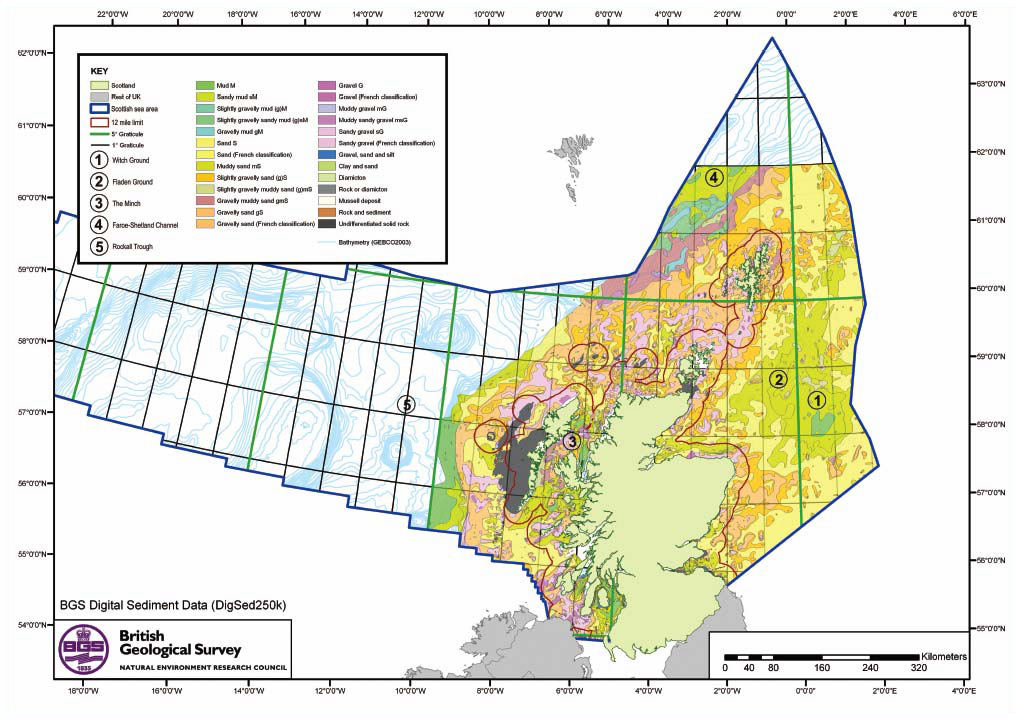
The existing seabed sediment maps (summarised in Figure 2.15) depict the grain size of the sediments. Samples were classified by grain size (the relative proportions of gravel, sand and mud) and the amount of terrigenous (land-derived) or calcareous materials (derived from the shells of marine organisms).
In general, the sediments around Scotland are sandy or gravelly and originate from deposits during the Quaternary glaciation. Strong currents and wave action may also have prevented deposition of recent muddy sediment or have winnowed it to leave a coarse-grained lag deposit. Muddy sediments occur principally nearshore, for example in estuaries where the sediment is supplied from the main rivers such as the Forth and Clyde. Further offshore, muddy sediments occur in depressions on the sea floor, where currents may be relatively weak, such as the Witch Ground and Fladen basins and in The Minch. They also occur beyond the shelf break (200 m water depth) to the west of Scotland, in the Faroe-Shetland Channel and the Rockall Trough. The concentration of calcareous material varies greatly in seabed sediments reflecting the amount of shell material in different areas; locally, they can be very high (over 75%) in areas such as the sea bed around Orkney and Shetland.
Figure 2.15 Distribution of seabed sediments around Scotland
CASE STUDY 2.3 Modelling bathymetric data
The Application of Multi-beam Echo-Sounders
In recent years, some areas of Scotland's sea bed have been surveyed using Multi-beam Echo-Sounders. These deliver high resolution depth data which can greatly improve physical process simulation (e.g. water flow/level) in computer models and also help to generate maps of seabed type. Multi-beam data from the Sound of Harris, in the Western Isles, are shown in Figure 2.16. Shaded bathymetry data (purple shallow, red deeper) are presented alongside an aerial photograph. Inset charts in Figure 2.16 show the effect of multi-beam bathymetry on computer model performance. In this case the greater the agreement between the yellow dots (real data) and the blue dots (model data) the better the computer model is simulating the flow of water. The Sound of Harris data shown in Figure 2.16 were collected under the Civil Hydrography Programme, operated by the MCA. Other areas around Scotland have been surveyed by a range of organisations for commercial, government and academic projects. Greater access to new and existing multi-beam data will help to improve the performance of all models of Scotland's seas.
Figure 2.16 Multi-beam bathymetry detail and the effect on computer model performance
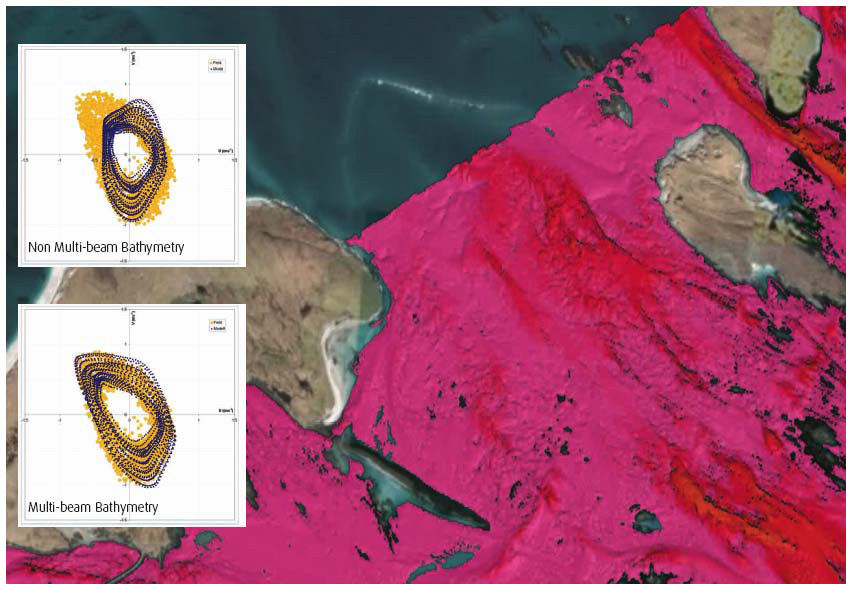
(Courtesy of MCA, Associated British Ports, Google Earth)
CASE STUDY 2.4 New primary production in Scottish waters, 1960-2003
Introduction
Primary production is the fundamental property which sets the productivity of the marine ecosystem as a whole. Impoverished regions which are starved of nutrients and the necessary trace elements required for phytoplankton growth can support only small fishery yields. In contrast, regions where oceanographic processes or major river inputs deliver large quantities of nutrient to the surface waters typically support substantial fisheries. Assessments of annual primary production can provide valuable information about overall yields from the sea.
Photosynthetic fixation of carbon in the oceans requires corresponding uptakes of inorganic nutrient elements (nitrogen, phosphorus, silicon) and trace elements such as iron and copper from the seawater. The annual supply of these elements to the shallow sunlit layers of the water column (the photic zone) therefore sets a limit to the amount of primary production that can occur. In practice, total annual primary production typically exceeds that which can be explained in terms of water column nutrient content at the start of the year. This is because a significant proportion of annual production utilises nutrients excreted back into the water column by herbivores and through the bacterial breakdown of detritus; referred to as 'recycled production'. In contrast, production derived from nutrients supplied to the photic zone by transport, mixing or atmospheric deposition is referred to as 'new production'. In temperate shelf seas where nitrogen is the main limiting nutrient element, new production is usually considered to be represented by the annual uptake of nitrate by phytoplankton, whilst regenerated production is represented by the uptake of ammonia.
The 'recycled' component of primary production reflects the metabolic requirements of the ecosystem since it is based on the within-season re-mineralisation of organic matter. 'New' production reflects the potential for growth and reproduction of higher trophic levels. Areas with a high proportion of recycled production would therefore be expected to exhibit low energy transfer efficiencies between total primary production and higher trophic levels. By considering new, rather than total, primary production as the basis for carbon and energy fluxes up the food web, explaining the production of higher trophic levels can, in theory, come closer.
Estimating new primary production
Direct measurements of nutrient uptake in the water column require complicated incubations of sub-sampled water supplemented with isotope labeled nutrient at a range of light intensities. These are inherently costly, and can only be undertaken at a very limited number of sites. Extrapolating from a few such measurements to obtain realistic estimates of new production over an area such as the North Sea is then practically impossible. An alternative is to apply a proxy measure of annual uptake which can be generated from nutrient data sets. Researchers at FRS have used nitrate concentrations in the sea water and inputs of nitrate by rivers and from the atmosphere as a proxy from which to calculate potential new primary production ( PNP). Assuming that there are no other advective, or diffusive inputs of nitrate during the annual phytoplankton bloom period, and no significant reliance on nitrate to support production outside this period, then the loss of nitrate from the water column in spring, plus the river and atmospheric input of nitrate during the spring and summer, equate to the depth integrated annual new production. Conversion from production in terms of nitrogen units to production in terms of carbon units is then achieved by assuming that the two elements are related according to the Redfield ratio (C:N molar ratio 106:16).
Data sources
Shelf seas nitrate data, the amount if oxidised inorganic nitrogen discharged to the sea from rivers and the oxidised nitrogen deposited on the seas surface with rainfall and dust particles were used in the determination. More details for each data source are presented in Annex 5.
Results
The modelled distribution of annual potential new primary production ( PNP) due to removal of nitrate from the water column is shown in Figure 2.17 using the year 2000 as an example. The analysis was restricted to continental shelf waters (shallower than 200 m), so it was not possible to provide summaries for the Rockall, Bailey and Faroe Shetland Channel regions (see Figure 1.7 for details of regions). In addition, the spatial resolution (graininess) of the model output was too coarse to meaningfully resolve small regions such as the Clyde. The Clyde and Irish Sea regions were therefore merged for the purposes of this case study. The year-to-year changes in new production due to water column uptake in each region covered by the data are shown in Figure 2.18.
Annual river inputs of oxidised nitrogen to each of the Scottish regions are shown in Figure 2.19. Inputs have shown an increasing trend only for the Irish Sea and Clyde. In other regions the inputs have been stable or declining. The input between March and September each year represents an additional contribution to potential new production, and was added to that estimated from the seawater nitrate data to produce an estimate of the total annual potential new primary production (Figure 2.18).
Annual atmospheric inputs of oxidised nitrogen (Figure 2.19) have shown a decreasing trend in all areas since 1980. The largest inputs are to the East Scotland Coast and Fladen areas, down-wind of the major centres of population. Inputs between March and September each year represent an additional contribution to potential new production, and were added to that estimated from the seawater nitrate data (Figure 2.18).
The combined results show that the highest rates of annual new primary production are confined to the outer shelf regions (West Shetland, North Scotland Coast and Hebrides). Long-term average potential new primary production declined with distance into the interior of the North Sea (Fladen and Forties), and was lowest in the inshore regions. River inputs during spring and summer had the greatest effect on annual potential new primary production in the East Scotland Coast region (11% of total annual PNP), Moray Firth (9%) and Irish Sea and Clyde region (7%). In all other areas, river inputs contributed less than 2% to total annual potential new primary production which was less than the input from atmospheric deposition (Figure 2.19). Potential new primary production in the northern areas declined through the 1970s from peak values in the 1960s and has been variable but stable thereafter. In the south-western areas, peak primary production was in the 1990s, whilst the North Sea regions showed no significant long-term trend.
Discussion
The analysis shows that annual river inputs of oxidised nitrogen to the assessment regions were small compared to, for example the southern North Sea (Figure 2.20). In contrast to the Scottish regions, annual potential new primary production in ICES area IVc (latitude interval 51.00ºN to 53.50ºN (English Channel - Humber Estuary) since 1960 has been strongly correlated with river inputs, with an increasing trend between 1960 and the mid-1980s, and decreasing thereafter (Figure 2.20). River inputs during the summer were estimated to contribute 20% of annual potential new primary production in ICES area IVc.
Evidence from salinity data shows that the high rates of potential new primary production in the outer shelf regions (Hebrides, North Scotland Coast and West Shetland) were sustained by inflows of nutrient rich North Atlantic water from across the continental shelf edge. Without this inflow of nitrate, and inflows from rivers and atmospheric deposition, the shelf waters would become depleted in nitrogen due to the action of denitrifying bacteria which cause the breakdown of nitrate to nitrogen gas and venting to the atmosphere. For this reason, the interior of the central North Sea, which is remote from both ocean and river inputs of nitrate, was characterised by low annual rates of potential new primary production. Atmospheric deposition, rather than river input was the major external source of nitrate to this region, contributing approximately 3% of annual PNP.
A study of the North Sea indicated that the annual production by plankton eating fish (mainly herring, sprat, sandeel and Norway pout) was approximately 7% of annual potential new primary production. These fish species are a vital link in the food web since they constitute the major food resource for the valuable predatory fish such as cod and whiting and the bird and mammal populations, and hence are referred to as forage fish. On the basis of the North Sea study, the potential new primary production results indicate that, averaged over the period 1960-2003, the potential forage fish production in Scottish waters could be approximately 10.2 million tonnes (wet weight) per annum (Table 2.4). The proportion of annual forage fish production which may be landed by fisheries without risking detrimental effects on high trophic levels will be variable, depending on, for example, the species and age composition of fish in a given area. In the North Sea, approximately 12% of annual forage fish production is landed each year by fisheries, but this includes the industrial fisheries for sandeels which are of minor importance in Scottish waters. Relating potential new primary production to potential landings is the subject of ongoing research.
Summary Assessment
Parameter |
Geographical region |
Key factors & pressures |
What the evidence shows |
Trend |
Status now |
Confidence in assessment |
Reason for overall status |
|---|---|---|---|---|---|---|---|
Annual new primary production ( PNP) |
Hebrides |
Climatic factors affecting oceanographic processes |
High PNP, supported mainly by nutrient influx from the ocean |
II |
Data available but models still need refining |
||
Annual new primary production |
West Shetland |
Climatic factors affecting oceanographic processes |
High PNP, supported mainly by nutrient influx from the ocean |
II |
Data available but models still need refining |
||
Annual new primary production |
North Scotland Coast |
Climatic factors affecting oceanographic processes |
High PNP, supported mainly by nutrient influx from the ocean |
II |
Data available but models still need refining |
||
Annual new primary production |
Fladden |
Climatic factors affecting oceanographic processes and atmospheric deposition |
Moderate PNP, supported by transport of nutrient from the outer shelf regions and atmospheric deposition |
II |
Data available but models still need refining |
||
Annual new primary production |
Irish Sea and Clyde |
Climatic factors affecting oceanographic processes and river inputs of nitrate, plus anthropogenic sources of nutrients |
Low PNP, supported mainly by transport of nutrient from neighbouring regions and an increasing trend in river nutrients |
I |
Data available but models still need refining and spatial resolution too coarse to delineate Clyde and inshore details |
||
Annual new primary production |
East Shetland |
Climatic factors affecting oceanographic processes |
Moderate PNP, supported mainly by transport of nutrient from the outer shelf regions |
II |
Data available but models still need refining |
||
Annual new primary production |
East Scotland Coast |
Climatic factors affecting oceanographic processes and river inputs of nitrate, plus anthropogenic sources of nutrients |
Low PNP, supported mainly by transport of nutrient from the North Sea regions and inputs of river nutrients |
I |
Data available but models still need refining and spatial resolution too coarse to delineate inshore details |
||
Annual new primary production |
Forties |
Climatic factors affecting oceanographic processes and atmospheric deposition |
Moderate PNP, supported mainly by transport of nutrient from the outer shelf regions and atmospheric deposition |
II |
Data available but models still need refining |
||
Annual new primary production |
Minches and Malin Sea |
Climatic factors affecting oceanographic processes and river inputs of nitrate and atmospheric deposition, plus anthropogenic sources of nutrients |
Low PNP, supported mainly by transport of nutrient from the outer shelf regions, inputs of river nutrients and atmospheric deposition |
I |
Data available but models still need refining and spatial resolution too coarse to delineate inshore details |
||
Annual new primary production |
Moray Firth |
Climatic factors affecting oceanographic processes and river inputs of nitrate, plus anthropogenic sources of nutrients |
Low PNP, supported mainly by transport of nutrient from the North Sea regions and inputs of river nutrients |
I |
Data available but models still need refining and spatial resolution too coarse to delineate inshore details |
Table 2.4 Annual potential new primary production
Region |
Sea surface area km 2 |
1960s |
1970s |
1980s |
1990s |
2000s |
1960-2003 |
1960-2003 |
|---|---|---|---|---|---|---|---|---|
Hebrides |
41,233 |
121.8 |
110.3 |
103.5 |
120.1 |
112.8 |
113.8 |
2,123.4 |
West Shetland |
34,695 |
166.1 |
114.2 |
98.1 |
89.1 |
105.7 |
115.9 |
1,818.8 |
North Scotland Coast |
46,056 |
121.6 |
91.7 |
80.8 |
81.5 |
87.8 |
93.4 |
1,945.5 |
Fladen |
37,036 |
72.0 |
58.0 |
56.0 |
55.4 |
61.4 |
60.4 |
1,012.6 |
Irish Sea and Clyde |
30,395 |
47.4 |
49.5 |
57.3 |
67.0 |
57.3 |
55.5 |
763.1 |
East Shetland |
15,038 |
138.8 |
101.5 |
94.1 |
82.9 |
98.9 |
103.8 |
706.4 |
East Scotland Coast |
38,065 |
45.3 |
39.7 |
40.3 |
42.5 |
42.7 |
42.0 |
723.7 |
Forties |
24,566 |
56.0 |
51.5 |
53.7 |
56.6 |
59.7 |
54.9 |
610.5 |
Minches and Malin Sea |
31,338 |
25.8 |
22.0 |
22.6 |
24.6 |
21.0 |
23.5 |
333.5 |
Moray Firth |
10,127 |
34.2 |
25.4 |
23.4 |
24.8 |
26.3 |
26.9 |
123.2 |
Combined Scottish Regions |
308,550 |
87.0 |
70.1 |
66.2 |
68.6 |
70.9 |
72.8 |
10,160.8 |
PNP (gC/m 2/y) averaged over each reporting region and over decades, together with the implied potential production of forage fish (plankton-eating fish, mainly herring, sprat, sandeel and Norway pout, thousands of tonnes wet weight/year) in each region. Average potential fish production assumed to be 7.3% of PNP.
Figure 2.17 Spatial distribution of annual PNP
PNP (gC/m 2/y) in the year 2000 for shelf waters shallower than 200 m, estimated from the draw-down of nitrate in the water column. Outlines of the reporting regions, as described in Figure 1.7, are overlaid in black and the 200 m depth contour in purple.
Figure 2.18 Time series of annual PNP (g carbon/m 2/year) in each of the Scottish reporting regions
Open symbols, estimates based on water column nitrate draw-down only; filled symbols, estimates including the contribution of river inputs of nitrate during spring and summer. The Irish Sea and Clyde regions have been combined. Panels arranged in approximate geographical order.
Figure 2.19 Time series of annual inputs of oxidised nitrogen and average proportion of annual new primary production
Upperpanel: time series of annual inputs of oxidised nitrogen (nitrate+nitrite, kt/y) from rivers to each of the reporting regions between 1960 and 2005. The Irish Sea and Clyde regions have been combined, and include inputs from England, Wales and Northern Ireland as well as from Scotland. Lower left panel: time series of annual inputs of oxidised nitrogen from river and atmospheric deposition to each region, estimated at 5 year intervals between 1980 and 2000. Lower right panel: average (1960-2003) proportion of annual new primary production in each region due to spring and summer (March-September) inputs of oxidized nitrogen from rivers and the atmosphere.
Figure 2.20 Time series of annual PNP in the southern North Sea and annual inputs of oxidised nitrogen
Upper panel: time series of annual PNP (gC/m 2/y) in the southern North Sea ( ICES area IVc, 51.00ºN - 53.50ºN (51º 00'N - 53º 30'N)). Open symbols, estimates based on water column nitrate draw-down, filled symbols, estimates including the contribution of river inputs of nitrate during spring and summer. Lower panel: Time series of annual inputs of oxidised nitrogen (nitrate+nitrite, kt/y) from rivers to the southern North Sea ( ICES area IVc) between 1960 and 2005.
CONCLUSION
Understanding the physical characteristics of the seas around Scotland, and their link to the wider-scale processes, is fundamental to understanding the state of Scotland's seas. A vast amount of data has been, and continues to be, gathered. However, in order that changes in the physical characteristics of the waters around Scotland can be detected and ascribed a cause, there is a need to continue collecting data and to developing models which can accurately reproduce the current situation as well as predict future trends. In preparing this chapter it is evident that:
- there remain areas of Scotland's waters that have been surveyed by lead line only;
- there is a need to provide a better understanding of the deep waters to the west of Scotland;
- pH is one of the water property measurements requiring increased attention;
- better knowledge of seabed sediments is required; and
- all those involved in the simulation of the waters around Scotland would benefit from a greater sharing of model information and data. In addition, access to information from a common model of Scotland's seas would provide more accurate inputs to smaller-scale local models, benefiting many types of studies.
Contact
Email: Central Enquiries Unit ceu@gov.scot