Scotland's Marine Economic Statistics 2019
Statistics on the economic contributions of Scotland’s marine sectors in 2019. Includes a time series of Gross Value Added (GVA), turnover and employment for marine sectors. The supporting documents include: accessible tables, a summary topic sheet and a pdf version of the publication.
Part of
15. References and Glossary
Aquaculture
Aquaculture or fish farming is the breeding and harvesting of plants and animals in water. It can take place in natural water bodies such as ponds, lakes, marshland or brackish water and the ocean. It can also be conducted in tanks, commonly found in fish hatcheries.
Aquaculture statistics
(Marine Scotland)
The Marine Scotland aquaculture statistics are based on two annual aquaculture surveys; one on finfish and one on shellfish. These are the source for production and employment data.
Scottish fish farm production surveys - gov.scot (www.gov.scot)
Scottish shellfish farm production surveys - gov.scot (www.gov.scot)
Annual Population Survey (APS)
The Annual Population Survey was used as the source for employment statistics.
Background tables related to Scotland’s Labour Market - People, Places and Regions
CEFAS
Centre for Environment, Fisheries and Aquaculture Science. CEFAS annually coordinates the supply of UK economic data on aquaculture to the EU.
Data Collection Framework DCF data
The European Commission’s Data Collection Framework (DCF) establishes a European Community framework for the collection, management and use of data in the fisheries industry. The Data Collection Framework (DCF) regulation is EU Regulation 2017/1004 which replaced EC Reg 199/2008.
Under the regulations, member states are required to compile a wide range of biological and economic data.
As the UK has now left the EU, these requirements no longer apply and have been replaced by the UK Fisheries Act 2020.
Fleet Economic Survey
(Seafish publication)
The Seafish Fleet Economic Performance Dataset contains financial, economic and operation performance indicators for the sea fisheries fleet for the period 2010-2020.
Food Standards Agency (FSA)
The FSA publish data on Approved Food Establishments. The data was used to provide the geographic distribution of fish processing plants.
Food Standards Agency Approved Food Establishments
Full Time Equivalent (FTE)
This allows part-time workers’ working hours to be standardised against those working full-time. The standardised figure is 1.0, which refers to a full-time worker. The SABS data is presented as head counts, i.e. not taking working hours (or seasonal employment) into account. All employment counts in this publication apart from the offshore wind estimates are presented as head counts to remain consistent with SABS presentation.
Gross Value Added (GVA)
Approximate Gross Value Added is the value generated by any unit engaged in the production of goods and services less any intermediate inputs into the production process.
While Turnover measures the value of the goods and services produced, GVA measures the net of inputs used (i.e. turnover less the value of intermediate inputs). GVA is a measure of the contribution the economy made to the production of goods and services, and as such is a more useful indicator.
Growth Sector Statistics Database
Scotland's Economic Strategy identifies sectors where Scotland has a distinct comparative advantage, including Food & Drink (including agriculture & fisheries). Figures from the Growth Sector Statistics Database are not directly comparable with these Marine Economic Statistics due to methodological differences.
Headcount
SABS reports employment by headcount i.e. the number of individuals working in a sector, not taking account of their working hours (or seasonal employment). All employment statistics in this publication are presented as head counts to remain consistent with SABS presentation. See FTE.
Marine Sector
Marine Scotland has defined the SABS industrial categories that make up the marine economy. These can be seen in Annex A. They are supplemented by other data in some industry sectors.
Marine Management Organisation (MMO)
The MMO licences, regulates and plans marine activities in the seas around England so that they’re carried out in a sustainable way. It is also manages fisheries data collection for the UK.
Processing sector statistics (Seafish publication)
Annual financial surveys of UK fish processors and a census of all UK fish processing businesses every two years. This survey is referred to but is not used in this report as the SABS data was more consistent.
Quarterly National Accounts of Scotland
The Quarterly National Accounts of Scotland provide national-level GVA estimates. The 2019 statistics for Scotland’s economy were used.
Scottish Annual Business Statistics (SABS)
SABS provides the core data for this publication.
SABS contains data mainly on the Production (including Manufacturing), Construction and Service Sectors in Scotland. The SABS data is published in tables that include information on businesses’ employment, turnover, purchases, estimates of approximate gross value added and labour costs. Businesses in the survey are classified according to industry group, geographical area and ownership.
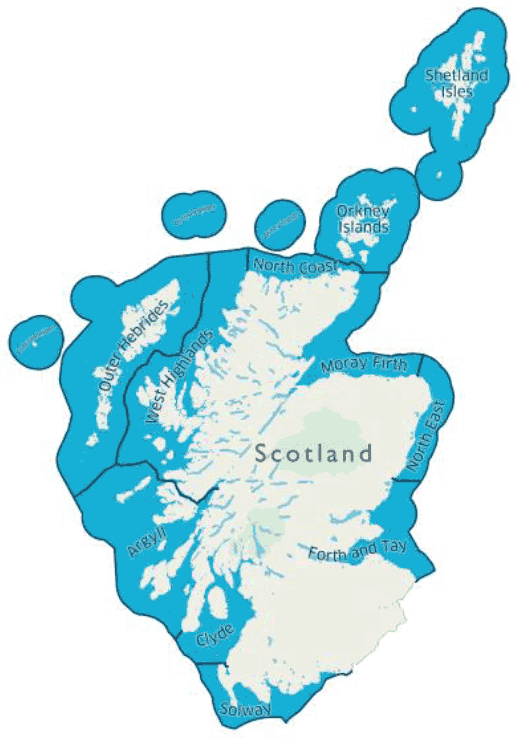
Scottish Marine Regions
Scottish Marine Regions were introduced by The Scottish Marine Regions Order 2015. The boundaries identify the areas for preparing and adopting regional marine plans. A map of these regions is shown below:
Scottish Sea Fisheries Statistics
(Marine Scotland publication)
This is an annual statistical bulletin that provides detailed statistics on the Scottish fishing fleet, fishers employment, and the quantity and value of fish landings for the year previous to publication year.
Seafish
Seafish is an industry funded body that supports the seafood industry to work for a sustainable, profitable future. It offers regulatory guidance and services to the seafood industry, including catching and aquaculture, processors, importers, exporters and distributors of seafood. It also collects and publishes economic and social data on seafood sectors.
Shipbuilding profile SABS analysis
SABS specialist analysis of Scottish shipbuilding figures in the SABS 2019 – industry profiles tables.
Standard Industrial Classification - SIC Codes
A Standard Industrial Classification (SIC) is used for classifying business establishments and other statistical units by the type of economic activity in which they are engaged. The classification provides a framework for the collection, tabulation, presentation and analysis of data, and its use promotes uniformity in defining and identifying industries. In addition, it can be used for administrative purposes and by non-government bodies as a convenient way of classifying industrial activities into a common structure.
The current codes were introduced in 2007 and are the reason that the reporting in this publication runs from 2008 onwards.
SIC 2007: structure and explanatory notes
Sustainable Tourism by Local Authority Area
SABS Analysis
SABS specialist analysis of Scottish tourism by local authority in the SABS 2019 excel tables.
Transport Scotland
Transport Scotland produce transport activity statistics. The passenger and freight activity data was extracted from Scottish Transport Statistics – No 39 – Datasets. Chapter 9 Water Transport. The data was supplied by ferry operators and is not classified as National Statistics. Scottish Transport Statistics No 39 2020 Edition
UK Fisheries Act 2020
Clause 1 of the UK Fisheries Act 2020 enables the collection of data on the management of fish and aquaculture activities based on the best available scientific advice. For continuity, the data collected replicate those previously collected under EU Reg 2017/1004 for the DCF survey.