Scotland's Marine Economic Statistics 2019
Statistics on the economic contributions of Scotland’s marine sectors in 2019. Includes a time series of Gross Value Added (GVA), turnover and employment for marine sectors. The supporting documents include: accessible tables, a summary topic sheet and a pdf version of the publication.
Part of
6. Seafood processing
6.1 Introduction
The seafood processing industry is defined in SABS as the “Processing and preserving of fish, crustaceans and molluscs”. In this publication, SABS information on seafood processing is used as the source data. Seafish publishes the processing data they collect in the processing enquiry tool which presents economic values for the processing of sea fish. Summary and background information is also available on the Seafish website. However, methodological differences mean that the SABS data allows for better comparisons with other industry results (see the Methodology section).
While fish processing is predominantly a terrestrial activity, the bulk of processing in Scotland is highly dependent on fish landed from Scottish waters. Therefore fish processing has been included in the definition of the marine economy.
6.2 Key economic points
In 2019, Seafood processing generated £390 million GVA: accounting for 0.26% of the overall Scottish economy and 8% of the marine economy GVA. Seafood processing provided employment for 6,800 people (headcount), contributing 0.26% to total Scottish employment and 9% to marine economy employment.
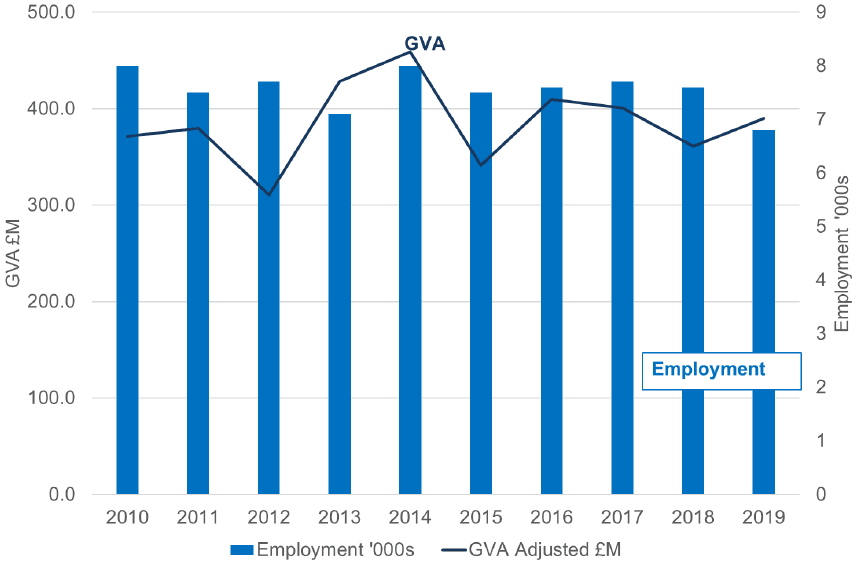
6.3 Seafood processing – trends
In 2019, the GVA from seafood processing (adjusted to 2019 prices) increased by 8% from the previous year, while the longer term trend from 2010 to 2019 showed that seafood processing GVA increased by 5%. Employment decreased by 15% between 2010 and 2019.
| Year | GVA (millions of pounds) | Turnover (millions of pounds) | Employment headcount (thousands) | GVA per head (pounds) |
|---|---|---|---|---|
| 2010 | 371 | 1,702 | 8.0 | 46,414 |
| 2011 | 380 | 1,464 | 7.5 | 50,609 |
| 2012 | 310 | 1,494 | 7.7 | 40,296 |
| 2013 | 428 | 1,747 | 7.1 | 60,298 |
| 2014 | 459 | 1,855 | 8.0 | 57,362 |
| 2015 | 341 | 1,702 | 7.5 | 45,519 |
| 2016 | 410 | 1,708 | 7.6 | 53,933 |
| 2017 | 401 | 1,867 | 7.7 | 52,057 |
| 2018 | 361 | 1,779 | 7.6 | 47,484 |
| 2019 | 390 | 1,707 | 6.8 | 57,368 |
6.4 Seafood processing by geography
The Food Standards Agency[7] publish a full list of establishments approved to handle, prepare or produce products of animal origin, including fish processing plants. This information was used to provide the number of fish processing businesses in Scotland by local authority. It does not consider volume of throughput, or type of fish.
As of January 2020, there were 272 registered fish processing plants in Scotland. The three local authorities with the highest number of plants were Aberdeenshire (52), Highland (40) and Aberdeen City (30).