Scotland's Marine Economic Statistics 2019
Statistics on the economic contributions of Scotland’s marine sectors in 2019. Includes a time series of Gross Value Added (GVA), turnover and employment for marine sectors. The supporting documents include: accessible tables, a summary topic sheet and a pdf version of the publication.
Part of
7. Shipbuilding
7.1 Introduction
Shipbuilding is represented in this report by the SABS SIC codes 30.1: Building of ships and boats and 33.15: Repair and maintenance of ships and boats. As part of the SABS annual publications, Scottish Government publishes a Shipbuilding Profile in the SABS excel tables, where the Scottish shipbuilding sector is analysed in relation to UK economic sectors.
Shipbuilding data can fluctuate considerably due to the spasmodic nature of the industry’s business. It can take a number of years to build and sell a ship, so purchase figures may be higher in some years and turnover higher in other years. Company re-structuring within the industry has also contributed to year-on-year fluctuations in statistics for the industry. The ONS estimation methodology produces regional estimates for both Scottish and non-Scottish business sites from single business returns which cover all UK activity. The SIC codes covered in the SABS shipbuilding profile provide a slightly narrower definition than the codes used for these marine economic statistics.
7.2 Key economic points
In 2019, Shipbuilding generated £408 million in GVA: accounting for 0.28% of the overall Scottish economy and 8% of the marine economy GVA. Shipbuilding provided employment for 6,300 people (headcount), contributing 0.24% of the total Scottish employment and 8% of the marine economy employment.
The SABS Shipbuilding Profile reports that Scottish shipbuilding accounted for around 23% of turnover and 19% of GVA of total UK output of the industry in 2019. This is a higher proportion than Scotland’s contribution to the whole of manufacturing, where Scotland accounted for around 6.5% of turnover and 8% of GVA of total UK manufacturing in 2019.
7.3 Shipbuilding – trends
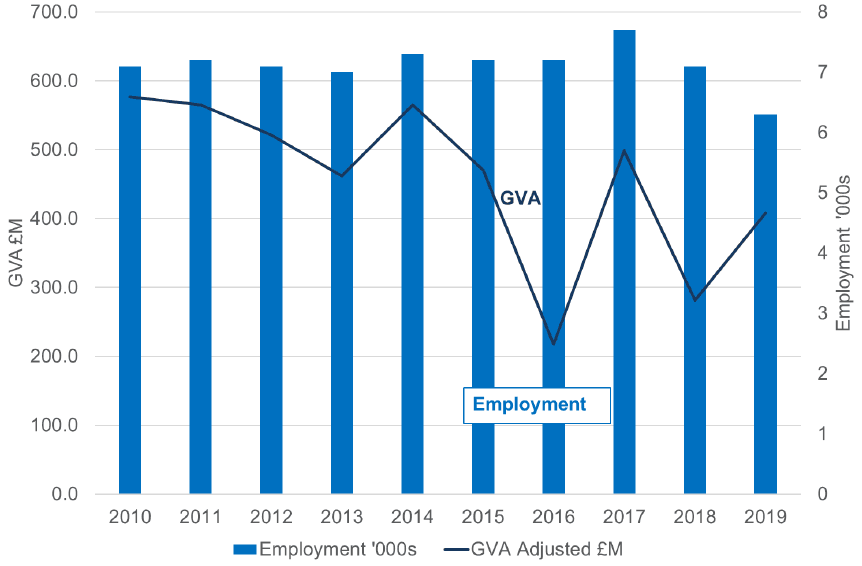
From 2018 to 2019, Shipbuilding GVA (adjusted to 2019 prices) increased by 45%, while the longer term trend from 2010 to 2019 showed that Shipbuilding GVA decreased by 29%. Employment decreased by 11% between 2010 and 2019.
The SABS supporting notes on the Shipbuilding Profile indicate that changes in a small number of (large) companies can have a have a very marked effect on the statistics, particularly on sectoral and local authority figures, from one year to the next. They point out that at this level of analysis (4-digit SIC), particular caution should be exercised when looking at year-on-year changes for the sector. Instead, figures should be used to chart long-term trends.
| Year | GVA (millions of pounds) | Turnover (millions of pounds) | Employment headcount (thousands) | GVA per head (pounds) |
|---|---|---|---|---|
| 2010 | 577 | 1,667 | 7.1 | 81,262 |
| 2011 | 565 | 1,636 | 7.2 | 78,509 |
| 2012 | 521 | 1,718 | 7.1 | 73,420 |
| 2013 | 462 | 1,363 | 7.0 | 66,043 |
| 2014 | 565 | 1,547 | 7.3 | 77,435 |
| 2015 | 471 | 1,778 | 7.2 | 65,370 |
| 2016 | 218 | 1,149 | 7.2 | 30,216 |
| 2017 | 499 | 1,597 | 7.7 | 64,763 |
| 2018 | 281 | 1,239 | 7.1 | 39,609 |
| 2019 | 408 | 1,094 | 6.3 | 64,825 |
Figure 10 shows the long term trend, demonstrating considerable fluctuation over the period 2010 to 2019. Over the same period, employment decreased slightly to around 6,300 workers.
7.4 Shipbuilding – by geography
The SABS Shipbuilding profile reports that the top three local authority areas in the shipbuilding sector in 2019 were Glasgow City, Aberdeen City and Fife, which together accounted for 74% of employment, 82% of turnover and 74% of GVA in the sector. It is not possible to supply a full individual list of local authorities with shipbuilding activity without being disclosive.