Scotland's Marine Economic Statistics 2019
Statistics on the economic contributions of Scotland’s marine sectors in 2019. Includes a time series of Gross Value Added (GVA), turnover and employment for marine sectors. The supporting documents include: accessible tables, a summary topic sheet and a pdf version of the publication.
Part of
11. Marine tourism and recreation
11.1 Introduction
In 2018, Marine Scotland developed the methodology for estimating marine tourism and recreation, separately from all tourism. This is based on SABS SIC codes used in the SABS reporting on Sustainable Tourism growth sectors[10] and where businesses are located in postcodes within 100 metres of the coastline. While this may include some businesses that are not marine-related, and exclude some that are marine-related, it is a reasonable and replicable method of estimating the marine tourism economy using existing data. This methodology was updated slightly in 2022, to use updated postcode and boundary data but this does not affect comparability. See Annex B section 18.10 for more information.
11.2 Key economic points
In 2019, marine tourism generated £598 million GVA: accounting for 0.4% of the overall Scottish economy and 12% of the marine economy GVA.
The marine tourism industry provided employment for 33,100 people (headcount), contributing 1.2% of the total Scottish employment. It is the biggest marine economy employer accounting for 44% of the marine economy employment. However, due to the seasonal and part time nature of tourism employment, the full time equivalent will be significantly smaller.
Scottish tourism as a whole was estimated to be worth £4.5 billion in GVA in 2019. Thus marine tourism is estimated to account for around 13% of all Scottish tourism in 2019, which is a slightly lower percentage than in 2018 (14%).
11.3 Marine tourism – trends
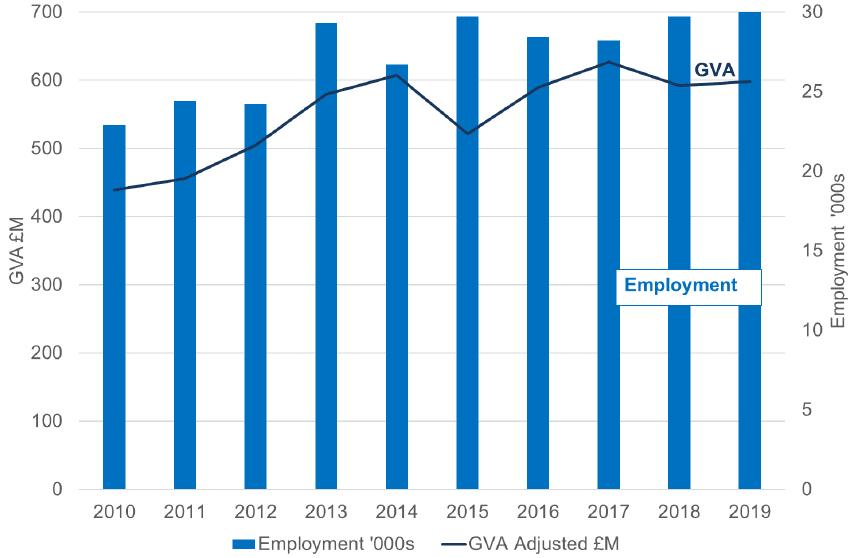
From 2018 to 2019, the GVA from marine tourism (adjusted to 2019 prices) increased by 1%, while the longer term trend from 2010 to 2019 showed that marine tourism GVA increased by 36%.
From 2010 to 2019, employment increased by 45%.
| Year | GVA (millions of pounds) | Turnover (millions of pounds) | Employment headcount (thousands) | GVA per head (pounds) |
|---|---|---|---|---|
| 2010 | 439 | 886 | 22.9 | 19,152 |
| 2011 | 456 | 930 | 24.4 | 18,682 |
| 2012 | 504 | 999 | 24.2 | 20,838 |
| 2013 | 580 | 1,064 | 29.3 | 19,784 |
| 2014 | 607 | 1,082 | 26.7 | 22,745 |
| 2015 | 521 | 973 | 29.7 | 17,549 |
| 2016 | 589 | 1,095 | 28.4 | 20,752 |
| 2017 | 627 | 1,082 | 28.2 | 22,223 |
| 2018 | 592 | 1,068 | 29.7 | 19,938 |
| 2019 | 598 | 1,111 | 33.1 | 18,076 |
11.4 Marine tourism by geography
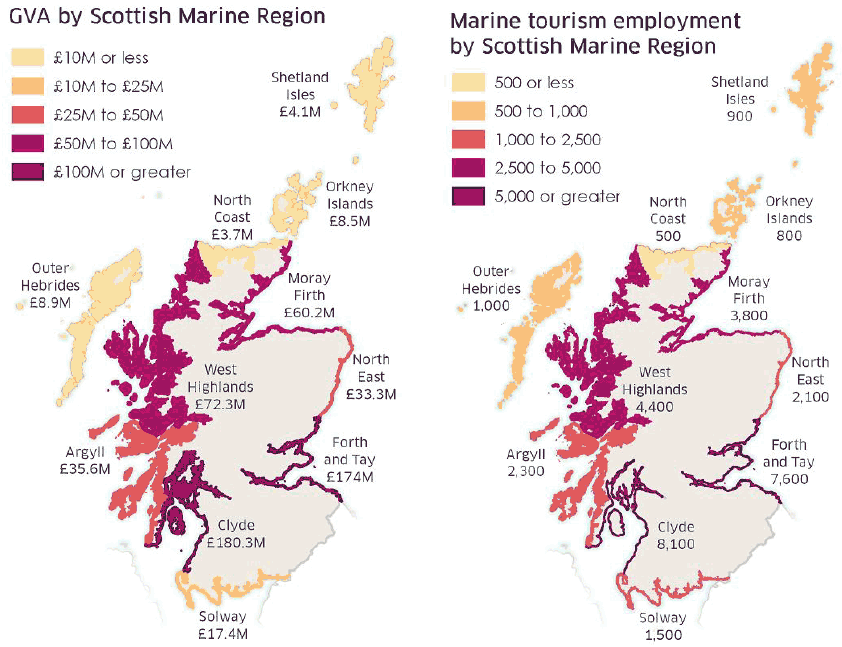
The marine tourism economic values were disaggregated to Scottish Marine Regions (local authority breakdown is unavailable due to the small quantity of data). While SMRs are geographies that relate to the sea, marine tourism value is earned on land and so Figure 18 shows outputs around the coast. The Clyde region was the largest contributor to marine tourism GVA in 2019 at £180 million (30% of the GVA), and to employment in 2019, (24% of the employment). The Forth and Tay region was the next highest accounting for 29% of the GVA and 23% of the employment.
| SMR | GVA (millions of pounds) | Turnover (millions of pounds) | Employment headcount (thousands) |
|---|---|---|---|
| Clyde | 180.3 | 306.1 | 8.1 |
| Forth and Tay | 174 | 303.1 | 7.6 |
| West Highlands | 72.3 | 130.8 | 4.4 |
| Moray Firth | 60.2 | 125.6 | 3.8 |
| Argyll | 35.6 | 67.1 | 2.3 |
| North East | 33.3 | 88.5 | 2.1 |
| Solway | 17.4 | 34 | 1.5 |
| Outer Hebrides | 8.9 | 18.6 | 1 |
| Orkney Islands | 8.5 | 20 | 0.8 |
| Shetland Isles | 4.1 | 9 | 0.9 |
| North Coast | 3.7 | 8 | 0.5 |
| Total | 598.3 | 1110.9 | 33.1 |
Scottish Government (Marine Scotland) 2020. © Crown copyright and database right