Scotland's Marine Economic Statistics 2019
Statistics on the economic contributions of Scotland’s marine sectors in 2019. Includes a time series of Gross Value Added (GVA), turnover and employment for marine sectors. The supporting documents include: accessible tables, a summary topic sheet and a pdf version of the publication.
Part of
4. Aquaculture
4.1 Introduction
Aquaculture is the breeding, growing and harvesting of plants and animals in water. It can take place in natural water bodies such as ponds, lakes, marshland or brackish water and the ocean. It can also be conducted in tanks, commonly found in fish hatcheries. Aquaculture production provides a range of seafood products:
Finfish – salmon, rainbow trout, brown trout and halibut
Shellfish – mussels, pacific oysters, native oysters, queen scallops and king scallops.
In this section the economic contribution of aquaculture has been estimated using two main data sources: Marine Scotland Aquaculture production survey statistics for 2019 and separate economic survey data collected to meet clause 1 of the UK Fisheries Act 2020. This replaces the previous European Commission’s Data Collection Framework requirements (DCF)[5], which no longer applies as the UK has left the EU. However, the data collected under the legislation is the same as under the previous DCF requirements. This approach allows for more reliable estimates of economic activity than SABS figures, primarily because the aquaculture production survey collects data for every production site registered as active during the survey year.
The aquaculture production survey statistics provide production and employment data, while the aquaculture economic survey provides financial data from a sample of salmon, trout and mussel farms. These are combined to calculate GVA figures. The GVA calculation methodology was revised in this year’s publication for all years to take account of the change in stock value. This makes the aquaculture GVA methodology more comparable to the SABS figures used for other industries. It should also help to minimise some of the year on year changes resulting from the multiyear aquaculture production process. For more information see Annex B, section 18.6. It should be noted that the values reported here differ from the SABS values due to methodological differences and the use of different data sources.
4.2 Key economic points
In 2019, aquaculture generated £560 million GVA: accounting for 0.38% of the overall Scottish economy and 11% of the marine economy GVA. The aquaculture industry provided employment for 2,406 people (headcount), contributing 0.09% of the total Scottish employment and 3% of the marine economy employment.
4.3 Aquaculture trends
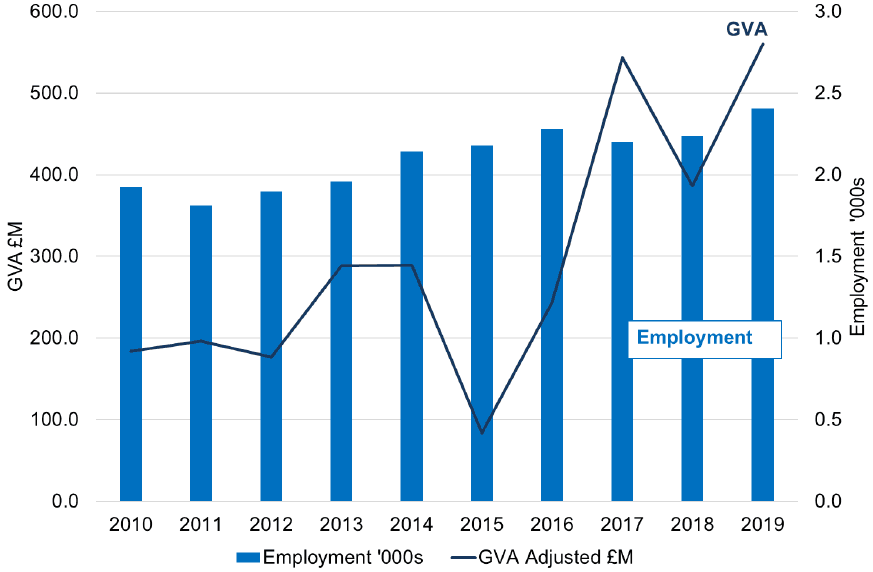
From 2018 to 2019, the GVA from aquaculture (adjusted to 2019 prices) increased by 45% from £387 million to £560 million, while the longer term trend from 2010 to 2019 increased by 205% from £184 million. From 2010 to 2019, employment increased by 25%.
In 2019, Atlantic salmon accounted for around 98% of the aquaculture farm gate value, similar to previous years. The production of the main aquaculture species, salmon, is a process that takes several years. One of the main producers of salmon in Scotland confirmed that 2017 was a production year and 2018 a stock raising year. This means that the production costs in both years would be similar, but output would be lower in 2018 as the majority of the salmon were immature. The production level, turnover and GVA for 2019 was similar to 2017.
| Year | GVA (millions of pounds) | Turnover (millions of pounds) | Employment headcount (thousands) | GVA per head (pounds) |
|---|---|---|---|---|
| 2010 | 184 | 659 | 1.92 | 95,554 |
| 2011 | 196 | 701 | 1.81 | 108,436 |
| 2012 | 177 | 633 | 1.90 | 93,088 |
| 2013 | 288 | 779 | 1.96 | 147,116 |
| 2014 | 289 | 814 | 2.14 | 134,989 |
| 2015 | 84 | 728 | 2.18 | 38,399 |
| 2016 | 243 | 849 | 2.28 | 106,690 |
| 2017 | 544 | 1,134 | 2.20 | 246,856 |
| 2018 | 387 | 941 | 2.24 | 172,705 |
| 2019 | 560 | 1,111 | 2.41 | 232,842 |
All years of Aquaculture GVA updated to include change in stock value see Annex B section 18.6.
In 2015, the aquaculture GVA dipped (see Figure 6) due to a combination of lower turnover and higher costs as a result of disease challenges. Aquaculture production is a multiyear process and is subject to varying costs due to uncontrollable factors like weather conditions and disease challenges. This results in large fluctuations in GVA between individual years. However the long term trend in GVA from aquaculture is a rapid increase to reach a peak of £560 million in 2019.
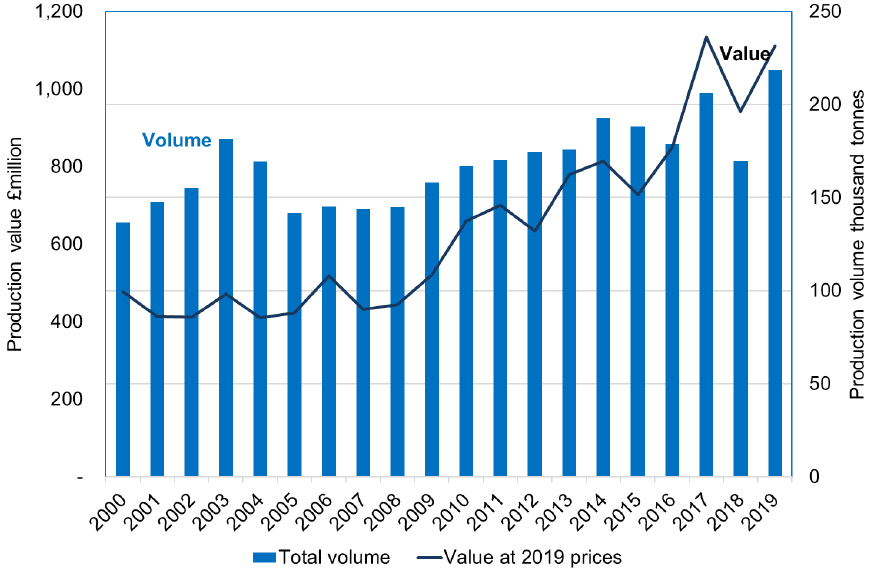
Total aquaculture production in Scotland in 2019 increased to 218 thousand tonnes (see Table 25). This is the highest production tonnage recorded to date, and had similar but slightly lower production value to 2017. Table 25 presents more detailed aquaculture data, including aquaculture breakdown by fin fish or shellfish. The GVA values are estimated using the volume and value of aquaculture in Figure 7. The chart shows the longer term trend in the aquaculture production.
4.4 Aquaculture by geography
It is not possible to disaggregate aquaculture statistics to local authority levels as these become disclosive. In the Marine Scotland Aquaculture Production Survey Statistics Atlantic salmon and mussel production figures are presented by Scottish marine region[6] (SMR) as far as possible. However, even at SMR level some regions in Table 7 have to be merged to avoid disclosure.
Atlantic salmon production value accounts for over 95% of all aquaculture, and so the salmon figures are reasonably representative of the economic distribution of aquaculture around Scotland. Table 7 shows the distribution of Atlantic salmon production around Scotland.
| Scottish Marine Region or combination | Percentage of Scottish value 2019 |
|---|---|
| Argyll and Clyde | 22% |
| Orkney Islands | 9% |
| Outer Hebrides | 19% |
| Shetland Isles | 18% |
| North Coast and West Highlands | 33% |
Mussel production mostly occurs in the Shetland Isles, accounting for three quarters of all Scottish production.
Table 26 and Table 27 present a time series of salmon and mussel production by region.