Scotland's Marine Economic Statistics 2019
Statistics on the economic contributions of Scotland’s marine sectors in 2019. Includes a time series of Gross Value Added (GVA), turnover and employment for marine sectors. The supporting documents include: accessible tables, a summary topic sheet and a pdf version of the publication.
Part of
5. Oil and gas services
5.1 Introduction
This section refers to the services that support the extraction of oil and gas, largely exploration and test drilling, but also looking ahead to oil and gas decommissioning, where there is substantial potential for economic growth. Oil and gas support activities are the largest contributors of turnover and GVA to the marine economy, although oil price changes tend to impact on the sector.
The SABS categories used to identify oil and gas services have changed in recent years. Since 2011, support services for oil and gas were extracted using the SIC code ‘09.1: Support activities for petroleum and natural gas extraction’. However, between 2008 and 2010 the code SIC ‘09 Mining support activities’ was used to ensure statistics were non-disclosive. The difference between statistics using the different SIC codes is insignificant, but it is important to note the change in coverage of the industry.
5.2 Key economic points
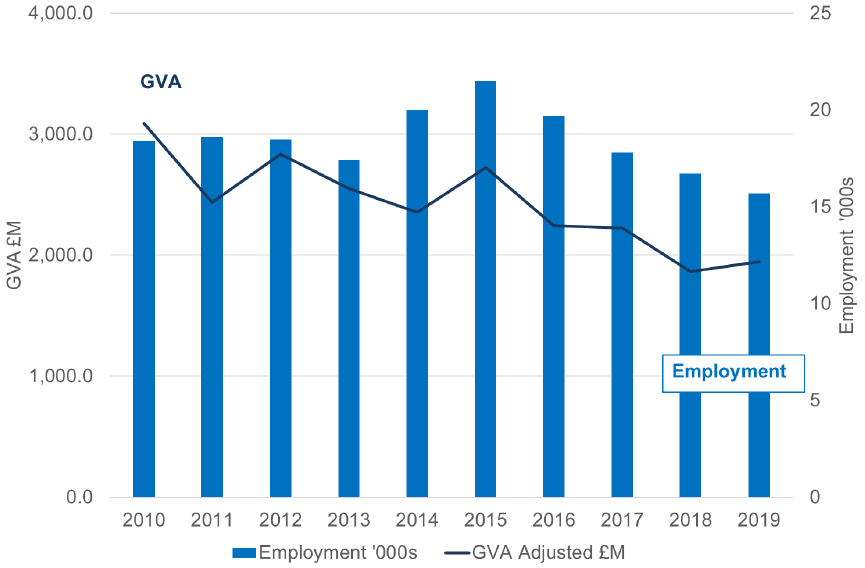
In 2019, oil and gas support services generated £1,945 million GVA: accounting for 1.31% of the overall Scottish economy GVA and 39% of the marine economy GVA. Oil and gas support services provided employment for 15,700 people (headcount), 0.59% of the total Scottish employment and 21% of the marine economy employment.
5.3 Oil and gas services - trends
The oil and gas support services GVA has declined by 37% since 2010, however between 2018 and 2019 GVA increased by 4% (adjusted to 2019 prices).
From 2010 to 2019, employment decreased by 15%, and it fell by 6% between 2018 and 2019.
| Year | GVA (millions of pounds) | Turnover (millions of pounds) | Employment headcount (thousands) | GVA per head (pounds) |
|---|---|---|---|---|
| 2010 | 3,090 | 6,653 | 18.4 | 167,940 |
| 2011 | 2,436 | 6,377 | 18.6 | 130,989 |
| 2012 | 2,837 | 6,631 | 18.5 | 153,378 |
| 2013 | 2,551 | 6,808 | 17.4 | 146,616 |
| 2014 | 2,354 | 7,440 | 20.0 | 117,718 |
| 2015 | 2,727 | 7,316 | 21.5 | 126,827 |
| 2016 | 2,243 | 4,763 | 19.7 | 113,834 |
| 2017 | 2,227 | 4,731 | 17.8 | 125,101 |
| 2018 | 1,865 | 4,277 | 16.7 | 111,672 |
| 2019 | 1,945 | 4,527 | 15.7 | 123,885 |
SABS categories changed between 2010 and 2011. See introduction to this section and Annex B section 18.7.
Geographic breakdown of oil and gas services is not readily available.