Scottish Household Survey 2024 findings: neighbourhoods and communities report
This report provides insights into neighbourhoods and communities in Scotland. It draws on key data from the Scottish Household Survey (2024) to explore neighbourhoods and communities both at a national level in Scotland and for different subgroups and different places.
Communities
In 2024 people were more positive about the people based features of their neighbourhood (such as kindness and trust) and less positive about the physical aspects of their neighbourhoods (such as the availability of places to socialise and meet new people). Since 2023 the physical aspects of neighbourhoods have stayed stable. However, there have been small declines in many people based features of neighbourhoods, such as kindness and trust (Table 1). None of the measures saw improvement from 2023.
People based aspects of neighbourhoods
In 2024, 83% agreed with the statement that “this is a neighbourhood where people are kind to each other”, and 79% agreed that “this is a neighbourhood where most people can be trusted” (Table 2.11 in the supporting Excel workbook). Seventy-nine percent of adults felt a ‘very strong’ or ‘fairly strong’ sense of belonging to their community (Table 2.21 in the supporting Excel workbook).
However since 2023 there have been small declines in a number of measures (Table 1). In 2024, 75% of adults agreed with the statement “I feel I could turn to someone in this neighbourhood for advice or support”, down from 80% in 2023 (Table 1, Figure 3). Seventy percent agreed that “this is a neighbourhood where people from different backgrounds get on well together” (a fall from 74% in 2023), and 59% agreed that “this is a neighbourhood where local people take action to help improve the neighbourhood”, down from 62% in 2023.
| Statements | 2023 | 2024 | Change |
|---|---|---|---|
| Neighbourhood kindness | 85% | 83% | -2 p.p |
| Neighbourhood trust | 81% | 79% | -2 p.p |
| People from different backgrounds get on well together | 74% | 70% | -4 p.p |
| Local people take action to improve the neighbourhood | 62% | 59% | -3 p.p |
| Neighbours would keep an eye on home | 85% | 84% | -2 p.p |
| Could turn to neighbours for advice or support | 80% | 75% | -5 p.p |
| Could rely on neighbours for help | 86% | 84% | -2 p.p |
| Strength of belonging to community (very/fairly strong) | 82% | 79% | -3 p.p |
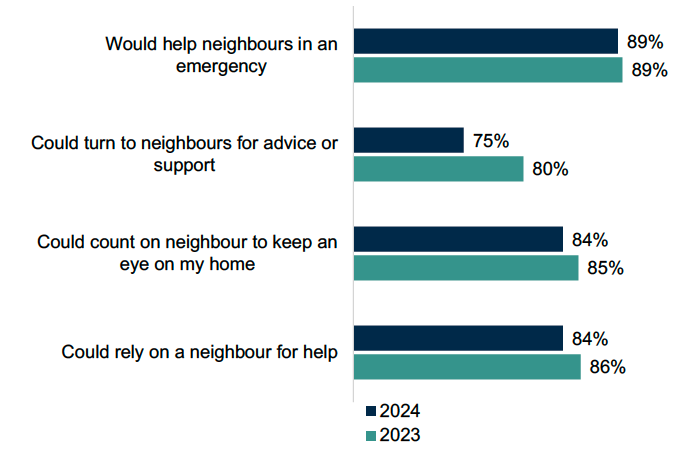
Percentage of adults agreeing with statements about their involvement with other adults in the neighbourhood, 2023 and 2024, Scotland[7]
Physical aspects of neighbourhoods
Sixty percent agreed that “there are places where people can meet up and socialise” (stable from 61% in 2023). Fifty-six percent agreed that “there are welcoming places and opportunities to meet new people”, stable from 56% in 2023 (Table 2.11 in supporting Excel workbook).
There are differences in people’s experiences depending on where people live, and for different subgroups of the population. This includes differences in more and less deprived areas, between urban and rural settings, by housing tenure and by characteristics such as age, disability, and ethnicity (Tables 2.12 to 2.30 in the supporting Excel workbook).
This section of the report will explore how these perceptions of people-based features of the neighbourhood (such as kindness and trust) and physical aspects of their neighbourhoods (such as the availability of places to socialise and meet new people) differ across these characteristics.
There is wide variation between Local Authorities in agreement that there are places to meet and socialise in the neighbourhood (Figure 4). Local Authorities with the highest agreement (shaded in dark blue on the map[8]) include Shetland Islands (84%), East Renfrewshire (82%), Scottish Borders (76%) and Orkney Islands (76%).
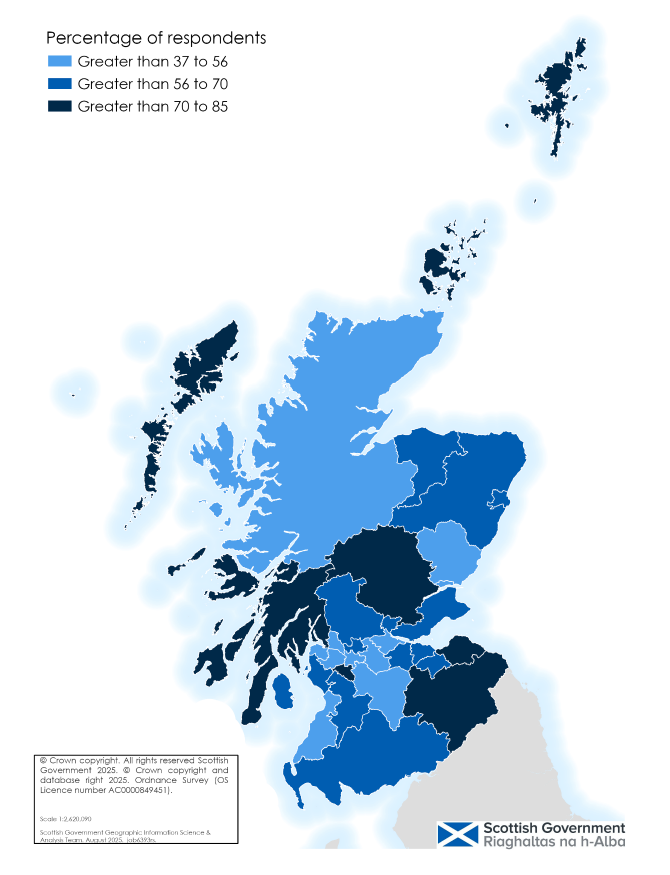
Percentage of adults who ‘agreed’ or ‘strongly agree’ there are places to meet and socialise, by Local Authority, 2024, Scotland[9]
In the 20% most deprived areas, just under two thirds (64%) agreed that “this is a neighbourhood where most people can be trusted” (Table 2.16 in the supporting Excel workbook). This compares to 88% of adults in the 20% least deprived areas. Forty-two percent of people in the most deprived areas agreed that “this is a neighbourhood where local people take action to help improve the neighbourhood”, compared with 68% in the least deprived areas.
Owner occupiers felt more positively about their neighbours than people who socially or privately rent (Table 2.17 in the supporting Excel workbook). In 2024, 86% of owner occupiers agreed that “this is a neighbourhood where most people can be trusted”, compared to 64% of people who rent socially. 65% of owner occupiers agreed that “this is a neighbourhood where local people take action to improve the neighbourhood”, compared to 44% of people who socially rent and 50% of private renters (Figure 5).
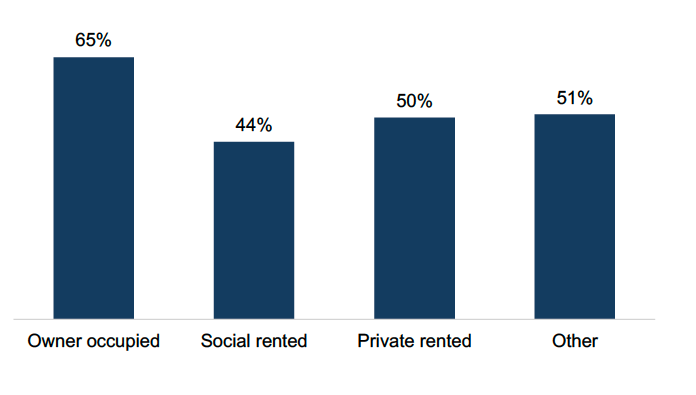
Percentage of adults who agree that local people take action to improve the neighbourhood by housing tenure, 2024, Scotland[10]
Perceptions of kindness and trust are highest in the oldest age groups. Eighty-one percent of 16 to 24 year olds agreed that others are kind to each other in their neighbourhoods, compared to 87% of those aged 75 and over (Tables 2.12 and 2.13 in the supporting Excel workbook).
Older age groups are more likely than younger age groups to agree they can rely on neighbours (Table 2.28 in the supporting Excel workbook). Seventy-nine percent of 16 to 24 year olds, and 76% of 25 to 34 year olds, agreed with the statement “If I was alone and needed help, I could rely on someone in this neighbourhood to help me”. This rises to 91% of adults aged 75 and over. Seventy-four percent of 16 to 24 year olds, and 73% of 25 to 34 year olds, agreed that “If my home was empty, I could count on someone in this neighbourhood to keep an eye on my home”. This rises to 91% of those aged 75 and over.
In 2024, people living in rural areas[11] tended to score higher than those in more urban settings on people based features such as neighbourhood trust and kindness (Table 2.15 in the supporting Excel workbook). Ninety percent of people in rural Scotland agreed that “this is a neighbourhood where most people can be trusted”, compared to 77% of the rest of Scotland.
There are differences by ethnicity and disability. In 2024, 60% of ‘White’ people agreed that “local people take action to improve the neighbourhood”, compared to 48% of ‘Other Ethnic Groups’ (Table 2.20 in the supporting Excel workbook). Fifty-one percent of disabled people agree “local people take action to improve the neighbourhood”, compared to 61% of non-disabled people (Table 2.19 in the supporting Excel workbook).
Sense of belonging varied by age, sex, ethnicity, disability, deprivation, urban and rural settings, and tenure (Tables 2.21 to 2.27 in the supporting Excel workbook).
Contact
Email: socialresearch@gov.scot